VEON's (NASDAQ:VEON) Shareholders Are Down 59% On Their Shares
For many, the main point of investing is to generate higher returns than the overall market. But even the best stock picker will only win with some selections. So we wouldn't blame long term VEON Ltd. (NASDAQ:VEON) shareholders for doubting their decision to hold, with the stock down 59% over a half decade.
See our latest analysis for VEON
There is no denying that markets are sometimes efficient, but prices do not always reflect underlying business performance. One way to examine how market sentiment has changed over time is to look at the interaction between a company's share price and its earnings per share (EPS).
VEON became profitable within the last five years. However, it made a loss in the last twelve months, suggesting profit may be an unreliable metric at this stage. Other metrics may better explain the share price move.
The revenue decline of 2.4% isn't too bad. But if the market expected durable top line growth, then that could explain the share price weakness.
The company's revenue and earnings (over time) are depicted in the image below (click to see the exact numbers).
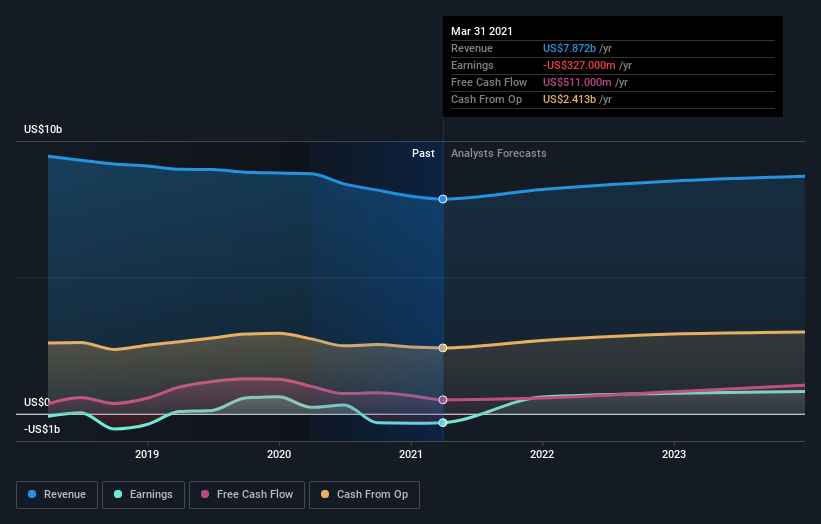
VEON is well known by investors, and plenty of clever analysts have tried to predict the future profit levels. Given we have quite a good number of analyst forecasts, it might be well worth checking out this free chart depicting consensus estimates.
What about the Total Shareholder Return (TSR)?
Investors should note that there's a difference between VEON's total shareholder return (TSR) and its share price change, which we've covered above. The TSR attempts to capture the value of dividends (as if they were reinvested) as well as any spin-offs or discounted capital raisings offered to shareholders. Its history of dividend payouts mean that VEON's TSR, which was a 45% drop over the last 5 years, was not as bad as the share price return.
A Different Perspective
VEON provided a TSR of 1.2% over the last twelve months. But that return falls short of the market. On the bright side, that's still a gain, and it is certainly better than the yearly loss of about 8% endured over half a decade. So this might be a sign the business has turned its fortunes around. Shareholders might want to examine this detailed historical graph of past earnings, revenue and cash flow.
If you are like me, then you will not want to miss this free list of growing companies that insiders are buying.
Please note, the market returns quoted in this article reflect the market weighted average returns of stocks that currently trade on US exchanges.
This article by Simply Wall St is general in nature. It does not constitute a recommendation to buy or sell any stock, and does not take account of your objectives, or your financial situation. We aim to bring you long-term focused analysis driven by fundamental data. Note that our analysis may not factor in the latest price-sensitive company announcements or qualitative material. Simply Wall St has no position in any stocks mentioned.
Have feedback on this article? Concerned about the content? Get in touch with us directly. Alternatively, email editorial-team (at) simplywallst.com.
