ViacomCBS Stock Continues To Fall: Technical Levels To Watch

ViacomCBS Inc. (NASDAQ: VIAC) stock was continuing to tumble Monday.
The stock was downgraded by Wells Fargo Friday and was also sold off as a result of a hedge fund's default on margin calls.
ViacomCBS shares were down 5.62% at $45.52 at last check.

Viacom Short-Term Chart Analysis: The 5-minute chart on Viacom above shows the stock has been in a steady downtrend throughout the last week.
It is possible to see the downtrend on the stock by connecting all of the highs on the chart with a straight line. The line connecting the highs has a negative slope, indicating the short-term downtrend.
With such a sharp drop of over 50%, it is tough to tell where the stock may bounce. Traders would like to see higher lows start taking place before an entry may be a good idea.
The stock would have to cross above the potential resistance line connected by the highs before the trend may change again.
The stock is trading below both the 200-day moving average (blue) as well as the volume-weighted average price (pink), adding to the bearish sentiment.
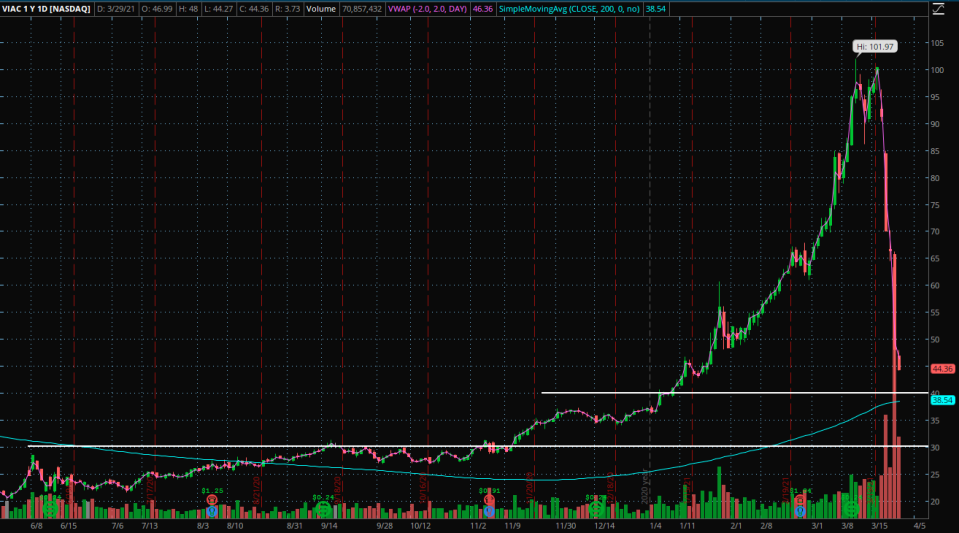
Viacom Daily Chart Analysis: The daily chart above shows two potential key levels where the stock may find support.
The first key level comes near a place where the stock previously had resistance before the stock was able to break out above. This level of support could occur near the $40 level.
Another potential area of support on the stock is near $30, as this was also a place the stock struggled to cross above for a time.
The stock on the daily chart is trading above the 200-day moving average (blue), indicating sentiment may still be bullish in the longer term. This moving average may be an area of potential support in the future.
See more from Benzinga
© 2021 Benzinga.com. Benzinga does not provide investment advice. All rights reserved.
