Is Vivendi SA (EPA:VIV) Struggling With Its 4.9% Return On Capital Employed?

Today we’ll evaluate Vivendi SA (EPA:VIV) to determine whether it could have potential as an investment idea. In particular, we’ll consider its Return On Capital Employed (ROCE), as that can give us insight into how profitably the company is able to employ capital in its business.
Firstly, we’ll go over how we calculate ROCE. Next, we’ll compare it to others in its industry. Last but not least, we’ll look at what impact its current liabilities have on its ROCE.
Understanding Return On Capital Employed (ROCE)
ROCE is a metric for evaluating how much pre-tax income (in percentage terms) a company earns on the capital invested in its business. All else being equal, a better business will have a higher ROCE. Ultimately, it is a useful but imperfect metric. Author Edwin Whiting says to be careful when comparing the ROCE of different businesses, since ‘No two businesses are exactly alike.’
So, How Do We Calculate ROCE?
Analysts use this formula to calculate return on capital employed:
Return on Capital Employed = Earnings Before Interest and Tax (EBIT) ÷ (Total Assets – Current Liabilities)
Or for Vivendi:
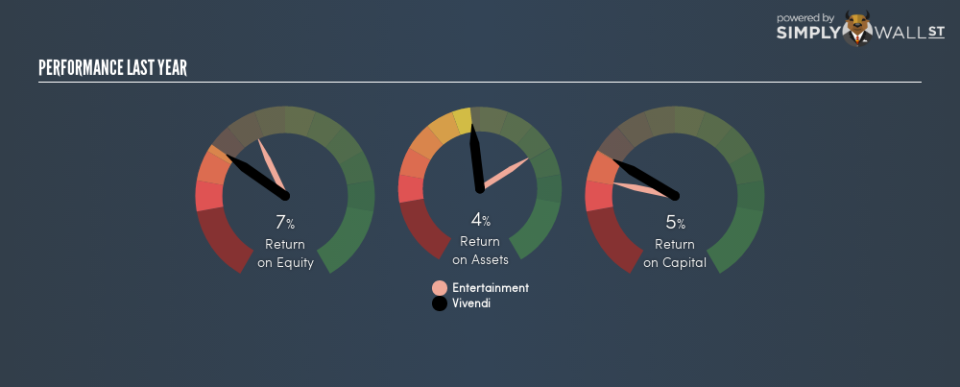
0.049 = €941m ÷ (€33b – €9.3b) (Based on the trailing twelve months to June 2018.)
So, Vivendi has an ROCE of 4.9%.
See our latest analysis for Vivendi
Is Vivendi’s ROCE Good?
ROCE is commonly used for comparing the performance of similar businesses. Using our data, Vivendi’s ROCE appears to be significantly below the 14% average in the Entertainment industry. This performance could be negative if sustained, as it suggests the business may underperform its industry. Aside from the industry comparison, Vivendi’s ROCE is mediocre in absolute terms, considering the risk of investing in stocks versus the safety of a bank account. It is possible that there are more rewarding investments out there.
As we can see, Vivendi currently has an ROCE of 4.9% compared to its ROCE 3 years ago, which was 2.6%. This makes us think the business might be improving.
When considering this metric, keep in mind that it is backwards looking, and not necessarily predictive. Companies in cyclical industries can be difficult to understand using ROCE, as returns typically look high during boom times, and low during busts. This is because ROCE only looks at one year, instead of considering returns across a whole cycle. What happens in the future is pretty important for investors, so we have prepared a free report on analyst forecasts for Vivendi.
Do Vivendi’s Current Liabilities Skew Its ROCE?
Short term (or current) liabilities, are things like supplier invoices, overdrafts, or tax bills that need to be paid within 12 months. The ROCE equation subtracts current liabilities from capital employed, so a company with a lot of current liabilities appears to have less capital employed, and a higher ROCE than otherwise. To counteract this, we check if a company has high current liabilities, relative to its total assets.
Vivendi has total liabilities of €9.3b and total assets of €33b. As a result, its current liabilities are equal to approximately 28% of its total assets. It is good to see a restrained amount of current liabilities, as this limits the effect on ROCE.
What We Can Learn From Vivendi’s ROCE
With that in mind, we’re not overly impressed with Vivendi’s ROCE, so it may not be the most appealing prospect. But note: Vivendi may not be the best stock to buy. So take a peek at this free list of interesting companies with strong recent earnings growth (and a P/E ratio below 20).
If you are like me, then you will not want to miss this free list of growing companies that insiders are buying.
To help readers see past the short term volatility of the financial market, we aim to bring you a long-term focused research analysis purely driven by fundamental data. Note that our analysis does not factor in the latest price-sensitive company announcements.
The author is an independent contributor and at the time of publication had no position in the stocks mentioned. For errors that warrant correction please contact the editor at editorial-team@simplywallst.com.
