W&T Offshore (WTI) Tops Q2 Earnings Estimates, Ups Output View
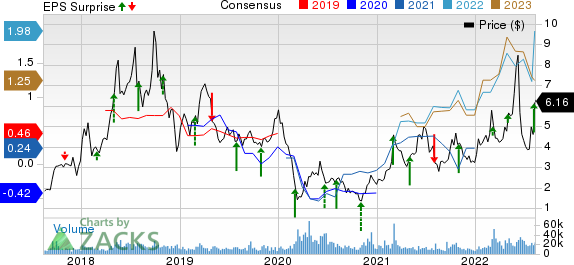
W&T Offshore, Inc. WTI reported second-quarter 2022 adjusted earnings (excluding one-time items) of $1.32 per share, beating the Zacks Consensus Estimate of 37 cents. The bottom line significantly improved from the year-ago quarter’s 1 cent per share.
Total quarterly revenues of $273.8 million surpassed the Zacks Consensus Estimate of $228 million. Also, the top line increased from $132.8 million in the prior-year quarter.
The strong quarterly results were supported by higher production and the realization of commodity prices.
W&T Offshore, Inc. Price, Consensus and EPS Surprise

W&T Offshore, Inc. price-consensus-eps-surprise-chart | W&T Offshore, Inc. Quote
Production Statistics
The total production averaged 42.4 thousand barrels of oil equivalent per day (MBoe/d), up from the year-ago quarter’s 40.9 MBoe/d.
Oil production was 1,476 thousand barrels (MBbls), up from the year-ago level of 1,352 MBbls. Also, natural gas liquids’ output totaled 384 MBbls, higher than 337 MBbls a year ago. However, natural gas production of 11,995 million cubic feet (MMcf) for the reported quarter was lower than 12,189 MMcf in the year-earlier period. Of the total production for the reported quarter, 48.2% comprised liquids.
Realized Commodity Prices
The average realized price for oil in the second quarter was $107.90 a barrel, higher than the year-ago level of $65.11. The average realized price of NGL increased to $43.58 from $26.18 per barrel in the prior year. The average realized price of natural gas for the June-end quarter was $7.70 per thousand cubic feet, up from $2.66 in the last year’s comparable period. The average realized price for oil-equivalent output increased to $69.55 per barrel from $34.75 a year ago.
Operating Expenses
Lease operating expenses rose to $13.73 per Boe in the second quarter from $12.78 a year ago. Also, general and administrative expenses increased to $3.88 per Boe from $3.76 in the year-ago period.
Overall, total costs and expenses increased to $111.5 million from the year-ago level of $99.3 million.
Cash Flow
Net cash from operations for the second quarter was $210.2 million, which significantly increased from $1.2 million in the year-ago period.
Free cash flow for the reported quarter increased to $233.5 million from $19.2 million in the year-ago quarter.
Capital Spending & Balance Sheet
W&T Offshore spent $8.1 million in capital through the June-end quarter (excluding acquisitions) on oil and gas resources.
As of Jun 30, 2022, the company’s cash and cash equivalents were $377.7 million, up from the first-quarter 2021 level of $215.5 million. Its net long-term debt as of the June-end quarter was $672 million, down from the prior-quarter level of $680 million. The current portion of the long-term debt is $37.2 million.
Guidance
For 2022, W&T Offshore revised its average daily oil-equivalent production upward to 39.5-42 MBoe/d from 38.2-42.2 MBoe/d mentioned earlier. The metric suggests an improvement from 38.1 MBoe/d reported last year. Oil production is expected to be 5,450-5,800 MBbls, while that of natural gas will likely be 45,300-48,200 MMcf.
For the third quarter, the company expects average daily oil-equivalent production of 39-44 MBoe/d. Oil production is anticipated to be 1,350-1,550 MBbls, while that of natural gas will likely be 11,300-12,800 MMcf.
The upstream company reiterated its capital spending budget for 2022 at $70-$90 million, which excludes acquisition opportunities. It expects lease operating expenses of $200-$210 million for the year.
Competitive Scenario
The rising commodity prices have been a tailwind for exploration and production companies. Benefitting from a surge in commodity prices, upstream companies like Marathon Oil Corporation MRO, Pioneer Natural Resources Company PXD and ConocoPhillips COP reported bumper profits in the second quarter of 2022.
Marathon Oil reported second-quarter 2022 adjusted net income per share of $1.32, beating the Zacks Consensus Estimate of $1.23. MRO’s bottom line was favorably impacted by stronger liquid realizations and solid domestic production.
In good news for investors, Marathon Oil is using the excess cash from a supportive environment to reward them with dividends and buybacks. As part of that, MRO executed $2.3 billion of share repurchases since October and hiked its dividend five times in the past six quarters.
Pioneer Natural reported second-quarter 2022 earnings of $9.36 per share (excluding one-time items), beating the Zacks Consensus Estimate of $8.81. Strong quarterly earnings were driven by higher oil-equivalent production volumes and commodity price realizations.
Pioneer Natural announced a dividend payment of $8.57 per share of common stock, which includes a variable dividend of $7.47 per share and a base dividend of $1.10. This suggests a 16.1% increase from the prior dividend of $7.38 per share.
ConocoPhillips reported second-quarter 2022 adjusted earnings per share of $3.91, beating the Zacks Consensus Estimate of $3.78. The strong quarterly results were driven by higher oil-equivalent production volumes and realized commodity prices.
ConocoPhillips raised its expected 2022 return of capital to shareholders. The new guidance is $15 billion versus the prior mentioned $10 billion. COP’s incremental returns to stockholders will get distributed through share repurchases and variable returns of cash tiers. Additionally, COP reported a fourth-quarter variable return of cash (VROC) payment of $1.40 per share, which reflects an increment of 100% from the third-quarter VROC.
Want the latest recommendations from Zacks Investment Research? Today, you can download 7 Best Stocks for the Next 30 Days. Click to get this free report
ConocoPhillips (COP) : Free Stock Analysis Report
Marathon Oil Corporation (MRO) : Free Stock Analysis Report
Pioneer Natural Resources Company (PXD) : Free Stock Analysis Report
W&T Offshore, Inc. (WTI) : Free Stock Analysis Report
To read this article on Zacks.com click here.
Zacks Investment Research
