Waiting for Godot? Indicators Remain Mildly Bearish

Waiting for Godot? Indicators Remain mildly bearish.
Bears point to recent lagging economic data, high equity valuations, and the greatly extended duration of the economic expansion. Bulls point to recent upbeat economic data, low relative equity valuations to bonds, and the strong historical track record of an incumbent presidential cycle.
Meanwhile our indicators remain bearish. However, a reversal and a bull market could potentially be just around the corner. Three important indicators are fractions away from turning bullish which would trigger an overall extremely positive reading. However, currently, our indicators remain bearish, much to our consternation. If another highly expected rate cut occurs, most of our indicators will turn bullish. Here is where we stand as of this writing.

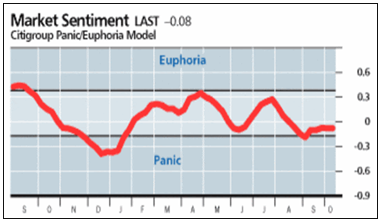
Market Sentiment: Bullish
The American Association of Individual Investors (AAII) sentiment index is showing one of the lowest bull-to-bear ratios in this elongated cycle at 0.54, with 21% bulls to 39% bears. The S&P 100 put to call ratio is 1.51 which also illustrates elevated bearishness in the future of the stock market. These indicators are contrarian, so a negative reading indicates a bullish outlook.
Technical Indicators: Bearish
Our technical indicators often directionally lag our sentiment indicators. In the aggregate, our indicators are tilting negative from the September sell off. However, the sell-off appears well contained as seen in the somewhat balanced 10-day moving average, with 333 issues up on volume and 466 issues down on volume. On a positive note, the 10-day moving average had 80 new all-time highs and 45 new all-time lows.
While all major large cap indices are above their 200-day moving averages, small cap indices have been struggling below their 200-day moving averages over this same time period. Small cap stocks have posted negative returns on a trailing 12-month basis and have remained below their 200 day moving averages since July. As a result, small cap stocks could currently entering a bear market.
Liquidity Indicators: Neutral
The IPO mania of September has now passed, producing over $25 billion in new equity. The bulls are awaiting large stock buyback announcements combined with renewed M&A activity, fueled by an implosion of interest rates to facilitate low cost borrowing. In comparison, investment grade (BBB) corporate bonds yield 3.6% while the S&P 500 has an earnings yield of 6.0%.
While NYSE margin debt is high relative to credit balances and fund flows into mutual funds and ETFs are slightly negative, there is a large amount of cash in money market funds, over $ 3.4 trillion dollars. This amount represents more than 11% of the total equity market valuation.
Valuations: Positive
Due to a significant decline in interest rates, equities currently look significantly undervalued relative to bonds. Therefore, one could reason that a successful hedged trade could be long the S&P 500 index ETF (SPY) and short a U.S. Aggregate Bond ETF, (AGG).
Based on this disequilibrium, our model shows the S&P 500 ETF (SPY) at a fair value of 4,200, with a 39% upside. We come to this conclusion from a combination of a 10% EPS growth over the next 12 months, expanding multiples based on a 3.6% BBB bond yield, and a 23 times earnings multiplier for the S&P 500.
Meanwhile, small and micro-cap stocks trade at 20 and 30% discounts to the S&P 500. The unweighted Russell 2000 index also trades at a significant discount to the S&P 500, further strengthening the argument of investor preference of large cap over small cap stocks.
EPS Momentum: Negative
Third quarter earnings growth is expected to be (4.1)%, representing the worst result since Q1 2016 which also had the characteristics of a bear market environment. Like the 2015-2016 time period, current aggregate earnings have been declining for three consecutive quarters. Over 70% of Q3 earnings reports thus far have been revised lower.
However, Q4 earnings reports are expected to reverse and post a 1.3% increase. Estimates for 2020 earnings show an expectation of a 10.6% EPS growth rate.
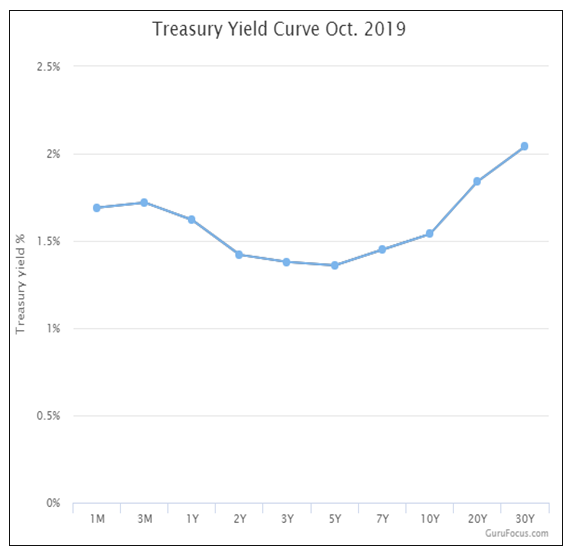
Monetary Indicators: Neutral
With one more Fed rate cut, this indicator will turn decisively bullish. Our excess liquidity indicator shows that the Fed is providing plenty of liquidity for growth with the M2 money supply, adjusted for velocity, growing at 97 basis points above nominal GDP. This estimate is based on second quarter results.
As advertised, the yield curve is inverted but much less so as of this writing. And, a potential 25 basis point rate cut will likely lead to a positive sloping yield curve in the near future. Our forward rate analysis forecast has short-term rates decreasing by 28 basis points. Such a forecast remains viable because the current federal funds rate is high enough to support such a decrease. Fed funds futures forecasts a 70% probability of a rate cut.
Conclusion
In summary, a 25 basis point rate cut is likely to drive our liquidity, monetary, and technical indicators to bullish levels. Until then, we hope the stock market is not like an elusive Godot and makes a decision, for better or worse.
Free trial subscription offer: Click here.
For more information and to subscribe, e-mail research@SingularResearch.com or call us at 818-222-6234.
Thank you,
Robert Maltbie, CFA
Singular Research, President
