
If you’re looking for reasons to be bullish on stocks, check out the technicals.
In a note to clients out Thursday, Stephen Suttmeier, a technical research analyst at Bank of America Merrill Lynch, outlined the case for why stocks look set to begin a “1950s-style” secular bull market.
And for those of you who don’t remember the 1950s bull market, it was a big one.

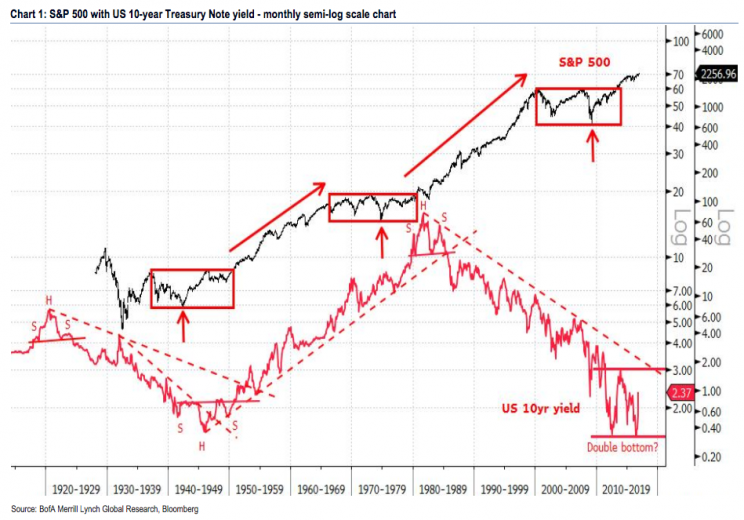
“Given the post-Brexit capitulation on ‘rates lower for longer’ and the seismic shift to ‘a rising rate environment,’ the current secular bulltrend best fits the 1950-1966 secular bull market,” Suttmeier writes.
“The 1950s was a period of higher stock prices and higher US interest rates. The US 10-year yield bottomed near 1.5% in late 1945 and the S&P 500 remained firmly within its secular bull market until yields moved to 5-6% in the mid 1960s. The S&P 500 rallied 460% over this period.” (Emphasis added.)
The near-term implications for stocks within this framework make the S&P 500 look set to rise towards 2,400 next year, and potentially towards 3,000 within just two years.
The quick run to 3,000, in Suttmeier’s outline, could come as investors accept that we’re looking at the beginning of a new trend in markets not merely seeing the final days of a bull run set to expire.
“Secular bulls start slowly given investor disbelief but build momentum over time as disbelief turns into acceptance,” Suttmeier writes.
“We believe that 2017 could be the year of acceptance for the secular bull trend that began on the April 2013 upside breakout. The April 2013 breakout is following the 1950 secular bull market, which saw the S&P 500 advance along with low but rising US interest rates.”
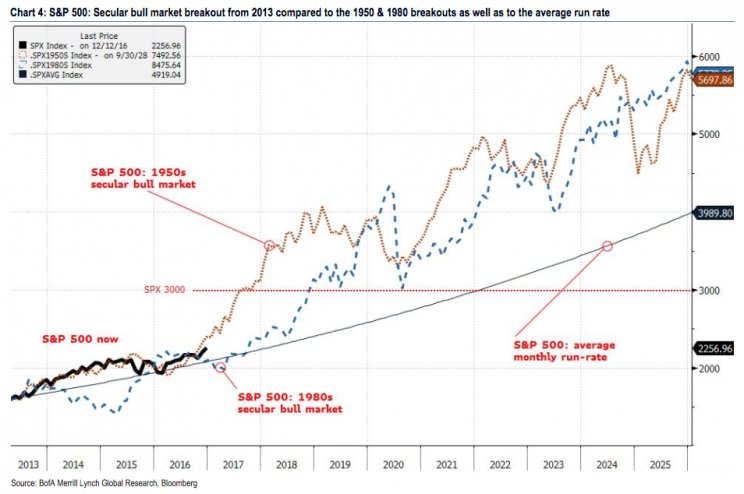
The following chart from BAML shows how the increase in stock prices accelerated as both the 1950s and 1980s bull markets got underway. And so if the black line starts rising at the rate of the gold line soon, we could see S&P 3,000. Even a rise to the pace of gains in the blue line would see stocks hit almost 6,000 within a decade.
Now, this isn’t the first bit of technical analysis we’ve seen that indicates stocks could be setting up for a major move to the upside.
Earlier this week, we highlighted a chart published by Citi that indicated 2017 could be a year of double-digit returns in the S&P 500.
And while some might be skeptical of technical analysis — “It’s just drawing lines on a chart,” detractors might say — stock market history has shown a strong propensity to repeat itself. Moreover, the stock market is not an entity unto itself.
Market prices are ultimately determined by what market participants themselves want to pay for certain assets. And if those participants believe in historical trends and the power of technical analysis then those very trends are more likely to come to pass.
—
Myles Udland is a writer at Yahoo Finance. Follow him on Twitter @MylesUdland
Read more from Myles here:
