Is The Walt Disney Company’s (NYSE:DIS) P/E Ratio Really That Good?

This article is written for those who want to get better at using price to earnings ratios (P/E ratios). To keep it practical, we’ll show how The Walt Disney Company’s (NYSE:DIS) P/E ratio could help you assess the value on offer. Walt Disney has a price to earnings ratio of 13.16, based on the last twelve months. That is equivalent to an earnings yield of about 7.6%.
See our latest analysis for Walt Disney
Want to help shape the future of investing tools and platforms? Take the survey and be part of one of the most advanced studies of stock market investors to date.
How Do I Calculate Walt Disney’s Price To Earnings Ratio?
The formula for price to earnings is:
Price to Earnings Ratio = Share Price ÷ Earnings per Share (EPS)
Or for Walt Disney:
P/E of 13.16 = $110.6 ÷ $8.4 (Based on the year to September 2018.)
Is A High Price-to-Earnings Ratio Good?
A higher P/E ratio means that investors are paying a higher price for each $1 of company earnings. All else being equal, it’s better to pay a low price — but as Warren Buffett said, ‘It’s far better to buy a wonderful company at a fair price than a fair company at a wonderful price.’
How Growth Rates Impact P/E Ratios
Probably the most important factor in determining what P/E a company trades on is the earnings growth. Earnings growth means that in the future the ‘E’ will be higher. That means unless the share price increases, the P/E will reduce in a few years. A lower P/E should indicate the stock is cheap relative to others — and that may attract buyers.
Walt Disney increased earnings per share by a whopping 47% last year. And its annual EPS growth rate over 5 years is 15%. With that performance, I would expect it to have an above average P/E ratio.
How Does Walt Disney’s P/E Ratio Compare To Its Peers?
The P/E ratio indicates whether the market has higher or lower expectations of a company. We can see in the image below that the average P/E (24.5) for companies in the entertainment industry is higher than Walt Disney’s P/E.
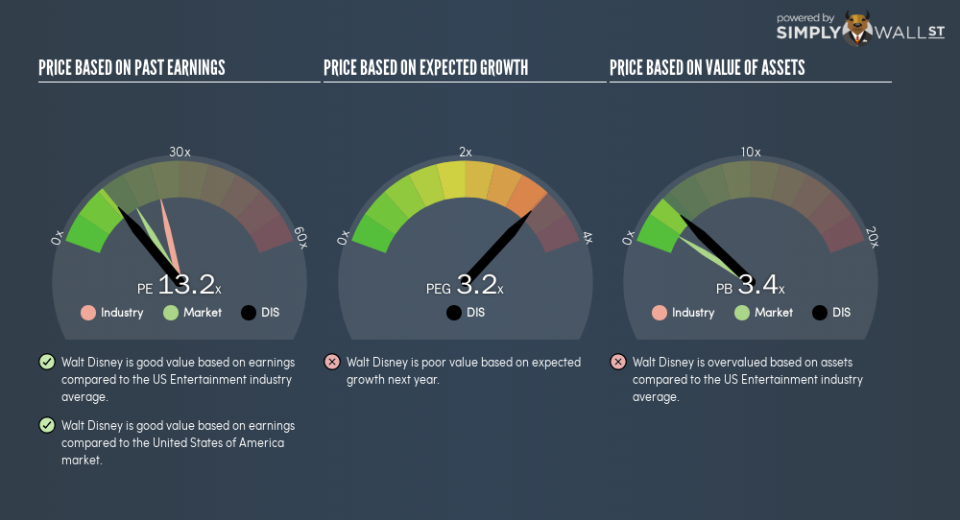
This suggests that market participants think Walt Disney will underperform other companies in its industry. Many investors like to buy stocks when the market is pessimistic about their prospects. You should delve deeper. I like to check if company insiders have been buying or selling.
Remember: P/E Ratios Don’t Consider The Balance Sheet
It’s important to note that the P/E ratio considers the market capitalization, not the enterprise value. That means it doesn’t take debt or cash into account. In theory, a company can lower its future P/E ratio by using cash or debt to invest in growth.
Spending on growth might be good or bad a few years later, but the point is that the P/E ratio does not account for the option (or lack thereof).
How Does Walt Disney’s Debt Impact Its P/E Ratio?
Walt Disney’s net debt is 10% of its market cap. This could bring some additional risk, and reduce the number of investment options for management; worth remembering if you compare its P/E to businesses without debt.
The Bottom Line On Walt Disney’s P/E Ratio
Walt Disney has a P/E of 13.2. That’s below the average in the US market, which is 17. The company hasn’t stretched its balance sheet, and earnings growth was good last year. If it continues to grow, then the current low P/E may prove to be unjustified.
When the market is wrong about a stock, it gives savvy investors an opportunity. As value investor Benjamin Graham famously said, ‘In the short run, the market is a voting machine but in the long run, it is a weighing machine.’ So this free report on the analyst consensus forecasts could help you make a master move on this stock.
Of course you might be able to find a better stock than Walt Disney. So you may wish to see this free collection of other companies that have grown earnings strongly.
To help readers see past the short term volatility of the financial market, we aim to bring you a long-term focused research analysis purely driven by fundamental data. Note that our analysis does not factor in the latest price-sensitive company announcements.
The author is an independent contributor and at the time of publication had no position in the stocks mentioned. For errors that warrant correction please contact the editor at editorial-team@simplywallst.com.
