Want To Invest In Nektan plc (AIM:NKTN)? Here’s How It Performed Lately

In this commentary, I will examine Nektan plc’s (AIM:NKTN) latest earnings update (31 December 2016) and compare these figures against its performance over the past couple of years, as well as how the rest of the software industry performed. As an investor, I find it beneficial to assess NKTN’s trend over the short-to-medium term in order to gauge whether or not the company is able to meet its goals, and ultimately sustainably grow over time. See our latest analysis for NKTN
Did NKTN’s recent EPS Growth beat the long-term trend and the industry?
I look at data from the most recent 12 months, which annualizes the most recent half-year data, or in some cases, the latest annual report is already the most recent financial year data. This method allows me to examine different companies on a more comparable basis, using the most relevant data points. For Nektan, the latest earnings -£2.7M, which compared to the previous year’s figure, has become less negative. Since these figures may be fairly nearsighted, I’ve determined an annualized five-year value for Nektan’s earnings, which stands at -£7.0M. This suggests that, despite the fact that net income is negative, it has become less negative over the years.
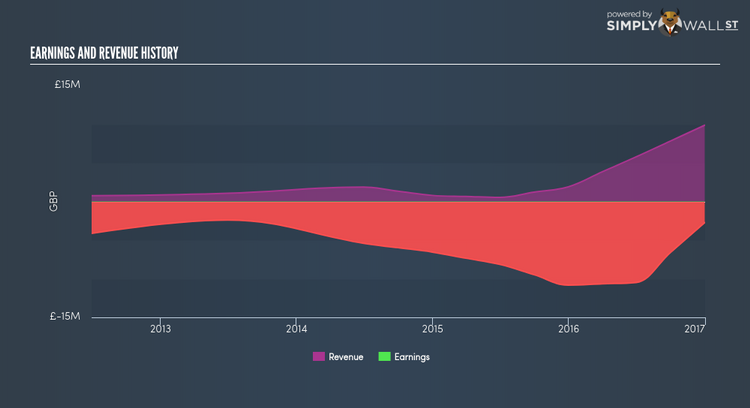
Additionally, we can examine Nektan’s loss by looking at what’s going on in the industry on top of within the company. Initially, I want to briefly look into the line items. Revenue growth over past few years has increased by 57.24%, indicating that Nektan is in a high-growth period with expenses shooting ahead of high top-line growth rates. Viewing growth from a sector-level, the UK software industry has been growing, albeit, at a unexciting single-digit rate of 6.46% over the past twelve months, and 3.99% over the past couple of years. This means despite the fact that Nektan is presently loss-making, it may have benefited from industry tailwinds, moving earnings towards to right direction.
What does this mean?
While past data is useful, it doesn’t tell the whole story. Companies that incur net loss is always difficult to envisage what will occur going forward, and when. The most useful step is to assess company-specific issues Nektan may be facing and whether management guidance has consistently been met in the past. I suggest you continue to research Nektan to get a better picture of the stock by looking at:
1. Financial Health: Is NKTN’s operations financially sustainable? Balance sheets can be hard to analyze, which is why we’ve done it for you. Check out our financial health checks here.
2. Valuation: What is NKTN worth today? Is the stock undervalued, even when its growth outlook is factored into its intrinsic value? The intrinsic value infographic in our free research report helps visualize whether NKTN is currently mispriced by the market.
3. Other High-Performing Stocks: Are there other stocks that provide better prospects with proven track records? Explore our free list of these great stocks here.
NB: Figures in this article are calculated using data from the last twelve months, which refer to the 12-month period ending on the last date of the month the financial statement is dated. This may not be consistent with full year annual report figures.
To help readers see pass the short term volatility of the financial market, we aim to bring you a long-term focused research analysis purely driven by fundamental data. Note that our analysis does not factor in the latest price sensitive company announcements.
The author is an independent contributor and at the time of publication had no position in the stocks mentioned.
