Want To Invest In Union Jack Oil plc (LON:UJO)? Here’s How It Performed Lately

After reading Union Jack Oil plc’s (AIM:UJO) most recent earnings announcement (30 June 2017), I found it useful to look back at how the company has performed in the past and compare this against the latest numbers. As a long-term investor I tend to focus on earnings trend, rather than a single number at one point in time. Also, comparing it against an industry benchmark to understand whether it outperformed, or is simply riding an industry wave, is a crucial aspect. Below is a brief commentary on my key takeaways. Check out our latest analysis for Union Jack Oil
Commentary On UJO’s Past Performance
I prefer to use the ‘latest twelve-month’ data, which either annualizes the most recent 6-month earnings update, or in some cases, the most recent annual report is already the latest available financial data. This blend allows me to assess various companies in a uniform manner using new information. For Union Jack Oil, its most recent trailing-twelve-month earnings is -UK£957.50K, which, in comparison to last year’s level, has become more negative. Since these figures may be relatively nearsighted, I have calculated an annualized five-year figure for Union Jack Oil’s earnings, which stands at -UK£651.58K. This doesn’t seem to paint a better picture, as earnings seem to have consistently been getting more and more negative over time.
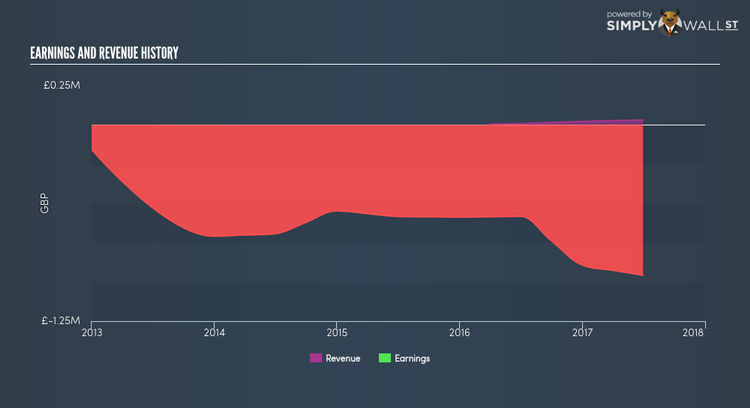
We can further assess Union Jack Oil’s loss by looking at what the industry has been experiencing over the past few years. Each year, for the past half a decade Union Jack Oil’s top-line more than doubled on average, signalling that the business is in a high-growth period with expenses racing ahead revenues, leading to annual losses. Eyeballing growth from a sector-level, the UK oil and gas industry has been growing its average earnings by double-digit 41.00% over the past twelve months, and a flatter 1.59% over the last five years. This shows that whatever tailwind the industry is deriving benefit from, Union Jack Oil has not been able to gain as much as its average peer.
What does this mean?
Though Union Jack Oil’s past data is helpful, it is only one aspect of my investment thesis. With companies that are currently loss-making, it is always difficult to envisage what will occur going forward, and when. The most useful step is to examine company-specific issues Union Jack Oil may be facing and whether management guidance has regularly been met in the past. You should continue to research Union Jack Oil to get a better picture of the stock by looking at:
1. Financial Health: Is UJO’s operations financially sustainable? Balance sheets can be hard to analyze, which is why we’ve done it for you. Check out our financial health checks here.
2. Other High-Performing Stocks: Are there other stocks that provide better prospects with proven track records? Explore our free list of these great stocks here.
NB: Figures in this article are calculated using data from the trailing twelve months from 30 June 2017. This may not be consistent with full year annual report figures.
To help readers see pass the short term volatility of the financial market, we aim to bring you a long-term focused research analysis purely driven by fundamental data. Note that our analysis does not factor in the latest price sensitive company announcements.
The author is an independent contributor and at the time of publication had no position in the stocks mentioned.
