
Warning: Chart Issues 'Sell' Signal for 3 Popular Dividend Stocks
Stock market indexes may be reaching record highs, but not all stocks are participating in the move. Some of the best-known companies in the world have charts that are on sell signals. This is a potential sign of trouble for the broader market since it would be difficult to move higher when market leaders are breaking down.
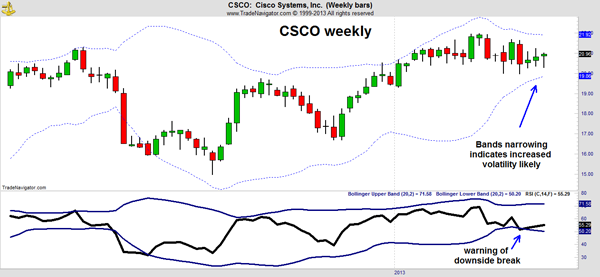
Cisco Systems (CSCO) just gave a sell signal when the Relative Strength Index (RSI) broke below the indicator's lower Bollinger Band. This comes at the same time Bollinger Bands drawn on prices are narrowing. When Bands around prices narrow, it is usually a signal that volatility in the stock is about to increase.
With RSI breaking down, the odds now favor an increase in volatility to the downside. Historically, CSCO has consistently declined in the quarter after this signal is given.
The company was one of the best stocks in the 1990s, gaining more than 115,000% from its 1990 IPO to its 2000 peak. But CSCO has transitioned to a value stock since then and now offers investors a yield of 3.2%.
Perhaps most troubling is that Cisco is a bellwether for the tech industry. The company is a leader in networking equipment and any slowdown in business could be a warning that demand for tech is falling. Analysts have been slowly lowering their opinion of CSCO over the past two months, and the chart now confirms that CSCO is a sell.
Drug company Pfizer (PFE), which offers investors a yield of 3.3%, is also on a sell signal. Momentum of Comparative Strength (MoCS) has fallen below its moving average, while the traditional relative strength (RS) calculation has plunged. PFE has been an underperformer while the market surged.
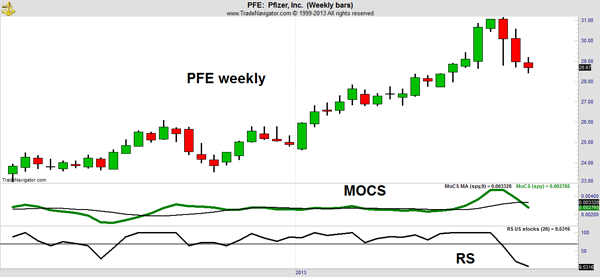
Analysts have been lowering their earnings estimates for 2013 and 2014. This is a company that has worsening fundamentals and bearish technicals. The yield may appear attractive in this well-known company, but it comes with a great deal of risk. Income investors should sell PFE.
American Express (AXP) gave a short-term sell signal after breaking out to new highs. In the chart below, Bollinger Bands have been added to the 20-day rate of change (ROC) in price.
Twenty days was used because that is about one month's time. Bollinger Bands are used to define when a price move becomes fast with a degree of statistical significance. When the 20-day ROC breaks above the upper Bollinger Band, it indicates that prices have been rising at an unsustainably rapid pace. A consolidation or sell-off should be expected after such a sharp move.

AXP has declined 60% of the time after this signal has been given. Investors in AXP should consider taking profits now to avoid a potential decline.
Stock market bulls might be gratified to see new highs in the indexes, but when looking at more detailed data, we see that there are signs of potential problems. The indexes could continue higher, but if they do, they are likely to do so without these three market leaders.
On a short-term basis, each of these charts offers a short trade opportunity for aggressive investors. These dividend stocks have a history of moving up in the long term. The fact that the charts show the likelihood of a decline is high in these three market leaders is unusually bearish. Conservative investors should at least defer purchases in these stocks if they choose not to take profits in them.
Related Articles
This Forgotten Stock Could Kick Off a Big Rally Next Week
Traders Who Ignore the Critics Could See 39% Returns by Year-End
Earn Immediate Income While Waiting for This Under $7 Stock to Rebound
