WD-40 Company (WDFC) Delivered A Better ROE Than The Industry, Here’s Why

WD-40 Company (NASDAQ:WDFC) outperformed the Household Products industry on the basis of its ROE – producing a higher 37.05% relative to the peer average of 17.92% over the past 12 months. On the surface, this looks fantastic since we know that WDFC has made large profits from little equity capital; however, ROE doesn’t tell us if management have borrowed heavily to make this happen. We’ll take a closer look today at factors like financial leverage to determine whether WDFC’s ROE is actually sustainable. See our latest analysis for WDFC
Peeling the layers of ROE – trisecting a company’s profitability
Firstly, Return on Equity, or ROE, is simply the percentage of last years’ earning against the book value of shareholders’ equity. For example, if WDFC invests $1 in the form of equity, it will generate $0.37 in earnings from this. Generally speaking, a higher ROE is preferred; however, there are other factors we must also consider before making any conclusions.
Return on Equity = Net Profit ÷ Shareholders Equity
ROE is measured against cost of equity in order to determine the efficiency of WDFC’s equity capital deployed. Its cost of equity is 8.49%. Since WDFC’s return covers its cost in excess of 28.55%, its use of equity capital is efficient and likely to be sustainable. Simply put, WDFC pays less for its capital than what it generates in return. ROE can be dissected into three distinct ratios: net profit margin, asset turnover, and financial leverage. This is called the Dupont Formula:
Dupont Formula
ROE = profit margin × asset turnover × financial leverage
ROE = (annual net profit ÷ sales) × (sales ÷ assets) × (assets ÷ shareholders’ equity)
ROE = annual net profit ÷ shareholders’ equity

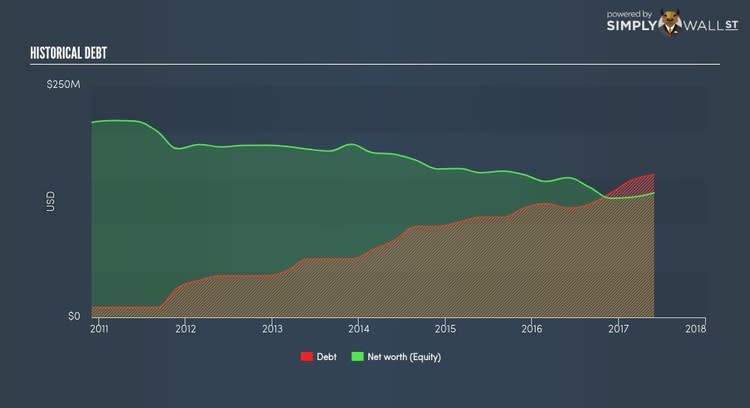
The first component is profit margin, which measures how much of sales is retained after the company pays for all its expenses. Asset turnover shows how much revenue WDFC can generate with its current asset base. Finally, financial leverage will be our main focus today. It shows how much of assets are funded by equity and can show how sustainable WDFC’s capital structure is. Since ROE can be artificially increased through excessive borrowing, we should check WDFC’s historic debt-to-equity ratio. The debt-to-equity ratio currently stands at a balanced 114.63%, meaning the above-average ROE is due to its capacity to produce profit growth without a huge debt burden.
What this means for you:
Are you a shareholder? WDFC exhibits a strong ROE against its peers, as well as sufficient returns to cover its cost of equity. Since its high ROE is not likely driven by high debt, it might be a good time to top up on your current holdings if your fundamental research reaffirms this analysis. If you're looking for new ideas for high-returning stocks, you should take a look at our free platform to see the list of stocks with Return on Equity over 20%.
Are you a potential investor? If you are considering investing in WDFC, looking at ROE on its own is not enough to make a well-informed decision. I recommend you do additional fundamental analysis by looking through our most recent infographic report on WD-40 to help you make a more informed investment decision.
To help readers see pass the short term volatility of the financial market, we aim to bring you a long-term focused research analysis purely driven by fundamental data. Note that our analysis does not factor in the latest price sensitive company announcements.
The author is an independent contributor and at the time of publication had no position in the stocks mentioned.
