WEC Energy Group Inc (NYSE:WEC) Delivered A Better ROE Than The Industry, Here’s Why

The content of this article will benefit those of you who are starting to educate yourself about investing in the stock market and want to start learning about core concepts of fundamental analysis on practical examples from today’s market.
With an ROE of 13.0%, WEC Energy Group Inc (NYSE:WEC) outpaced its own industry which delivered a less exciting 10.1% over the past year. On the surface, this looks fantastic since we know that WEC has made large profits from little equity capital; however, ROE doesn’t tell us if management have borrowed heavily to make this happen. We’ll take a closer look today at factors like financial leverage to determine whether WEC’s ROE is actually sustainable.
View our latest analysis for WEC Energy Group
Breaking down ROE — the mother of all ratios
Firstly, Return on Equity, or ROE, is simply the percentage of last years’ earning against the book value of shareholders’ equity. For example, if the company invests $1 in the form of equity, it will generate $0.13 in earnings from this. In most cases, a higher ROE is preferred; however, there are many other factors we must consider prior to making any investment decisions.
Return on Equity = Net Profit ÷ Shareholders Equity
ROE is assessed against cost of equity, which is measured using the Capital Asset Pricing Model (CAPM) – but let’s not dive into the details of that today. For now, let’s just look at the cost of equity number for WEC Energy Group, which is 8.6%. This means WEC Energy Group returns enough to cover its own cost of equity, with a buffer of 4.4%. This sustainable practice implies that the company pays less for its capital than what it generates in return. ROE can be split up into three useful ratios: net profit margin, asset turnover, and financial leverage. This is called the Dupont Formula:
Dupont Formula
ROE = profit margin × asset turnover × financial leverage
ROE = (annual net profit ÷ sales) × (sales ÷ assets) × (assets ÷ shareholders’ equity)
ROE = annual net profit ÷ shareholders’ equity

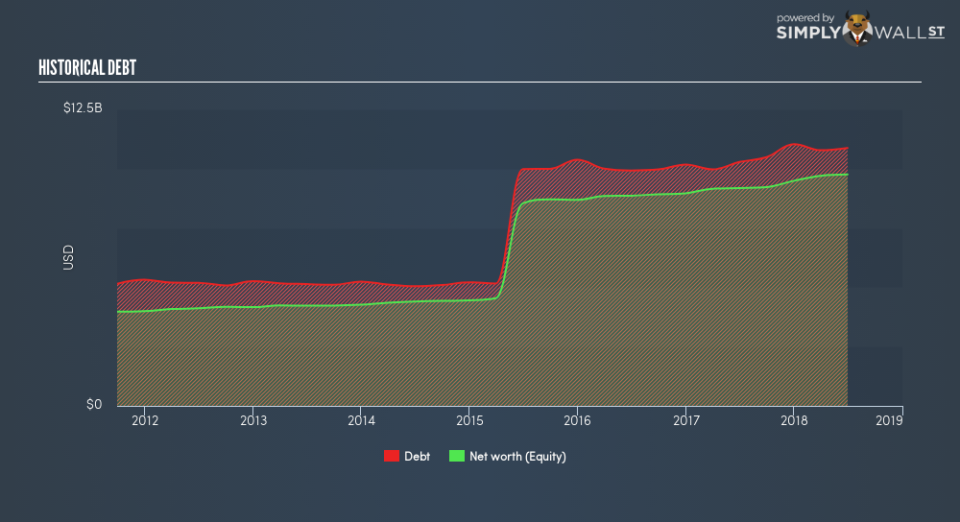
The first component is profit margin, which measures how much of sales is retained after the company pays for all its expenses. The other component, asset turnover, illustrates how much revenue WEC Energy Group can make from its asset base. And finally, financial leverage is simply how much of assets are funded by equity, which exhibits how sustainable the company’s capital structure is. Since ROE can be inflated by excessive debt, we need to examine WEC Energy Group’s debt-to-equity level. The debt-to-equity ratio currently stands at a balanced 111%, meaning the above-average ROE is due to its capacity to produce profit growth without a huge debt burden.
Next Steps:
ROE is one of many ratios which meaningfully dissects financial statements, which illustrates the quality of a company. WEC Energy Group’s above-industry ROE is encouraging, and is also in excess of its cost of equity. Its high ROE is not likely to be driven by high debt. Therefore, investors may have more confidence in the sustainability of this level of returns going forward. Although ROE can be a useful metric, it is only a small part of diligent research.
For WEC Energy Group, there are three important factors you should look at:
Financial Health: Does it have a healthy balance sheet? Take a look at our free balance sheet analysis with six simple checks on key factors like leverage and risk.
Management:Have insiders been ramping up their shares to take advantage of the market’s sentiment for WEC Energy Group’s future outlook? Check out our management and board analysis with insights on CEO compensation and governance factors.
Other High-Growth Alternatives : Are there other high-growth stocks you could be holding instead of WEC Energy Group? Explore our interactive list of stocks with large growth potential to get an idea of what else is out there you may be missing!
To help readers see past the short term volatility of the financial market, we aim to bring you a long-term focused research analysis purely driven by fundamental data. Note that our analysis does not factor in the latest price-sensitive company announcements.
The author is an independent contributor and at the time of publication had no position in the stocks mentioned. For errors that warrant correction please contact the editor at editorial-team@simplywallst.com.
