We're A Little Worried About Red Moon Resources's (CVE:RMK) Cash Burn Rate

We can readily understand why investors are attracted to unprofitable companies. For example, biotech and mining exploration companies often lose money for years before finding success with a new treatment or mineral discovery. But the harsh reality is that very many loss making companies burn through all their cash and go bankrupt.
So, the natural question for Red Moon Resources (CVE:RMK) shareholders is whether they should be concerned by its rate of cash burn. For the purpose of this article, we'll define cash burn as the amount of cash the company is spending each year to fund its growth (also called its negative free cash flow). We'll start by comparing its cash burn with its cash reserves in order to calculate its cash runway.
View our latest analysis for Red Moon Resources
When Might Red Moon Resources Run Out Of Money?
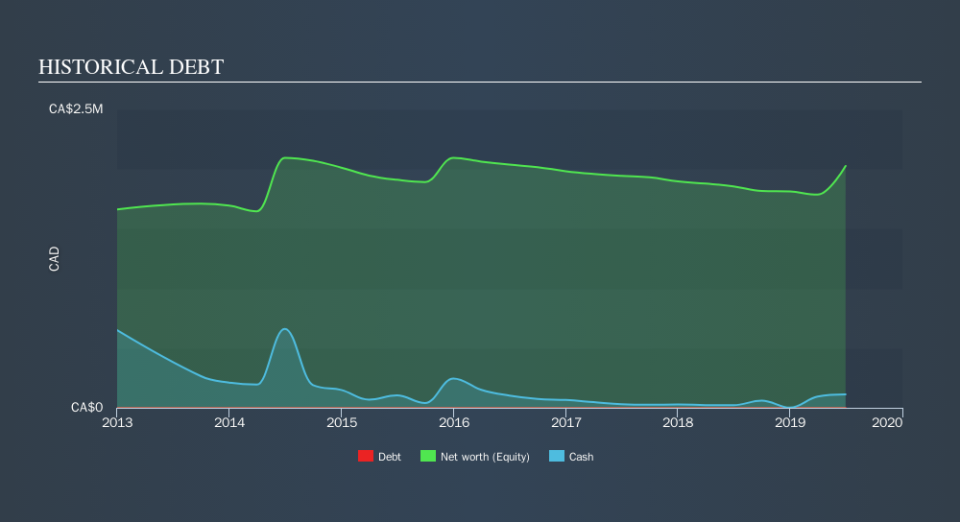
You can calculate a company's cash runway by dividing the amount of cash it has by the rate at which it is spending that cash. As at June 2019, Red Moon Resources had cash of CA$113k and no debt. Importantly, its cash burn was CA$235k over the trailing twelve months. That means it had a cash runway of around 6 months as of June 2019. With a cash runway that short, we strongly believe that the company must raise cash or else douse its cash burn promptly. Depicted below, you can see how its cash holdings have changed over time.
How Is Red Moon Resources's Cash Burn Changing Over Time?
Red Moon Resources didn't record any revenue over the last year, indicating that it's an early stage company still developing its business. So while we can't look to sales to understand growth, we can look at how the cash burn is changing to understand how expenditure is trending over time. In fact, it ramped its spending strongly over the last year, increasing cash burn by 169%. It's fair to say that sort of rate of increase cannot be maintained for very long, without putting pressure on the balance sheet. Admittedly, we're a bit cautious of Red Moon Resources due to its lack of significant operating revenues. So we'd generally prefer stocks from this list of stocks that have analysts forecasting growth.
Can Red Moon Resources Raise More Cash Easily?
Given its cash burn trajectory, Red Moon Resources shareholders should already be thinking about how easy it might be for it to raise further cash in the future. Companies can raise capital through either debt or equity. Commonly, a business will sell new shares in itself to raise cash to drive growth. We can compare a company's cash burn to its market capitalisation to get a sense for how many new shares a company would have to issue to fund one year's operations.
Since it has a market capitalisation of CA$1.8m, Red Moon Resources's CA$235k in cash burn equates to about 13% of its market value. Given that situation, it's fair to say the company wouldn't have much trouble raising more cash for growth, but shareholders would be somewhat diluted.
So, Should We Worry About Red Moon Resources's Cash Burn?
On this analysis of Red Moon Resources's cash burn, we think its cash burn relative to its market cap was reassuring, while its increasing cash burn has us a bit worried. Considering all the measures mentioned in this report, we reckon that its cash burn is fairly risky, and if we held shares we'd be watching like a hawk for any deterioration. When you don't have traditional metrics like earnings per share and free cash flow to value a company, many are extra motivated to consider qualitative factors such as whether insiders are buying or selling shares. Please Note: Red Moon Resources insiders have been trading shares, according to our data. Click here to check whether insiders have been buying or selling.
Of course, you might find a fantastic investment by looking elsewhere. So take a peek at this free list of interesting companies, and this list of stocks growth stocks (according to analyst forecasts)
We aim to bring you long-term focused research analysis driven by fundamental data. Note that our analysis may not factor in the latest price-sensitive company announcements or qualitative material.
If you spot an error that warrants correction, please contact the editor at editorial-team@simplywallst.com. This article by Simply Wall St is general in nature. It does not constitute a recommendation to buy or sell any stock, and does not take account of your objectives, or your financial situation. Simply Wall St has no position in the stocks mentioned. Thank you for reading.
