Do You Like WesBanco, Inc. (NASDAQ:WSBC) At This P/E Ratio?

Want to participate in a short research study? Help shape the future of investing tools and you could win a $250 gift card!
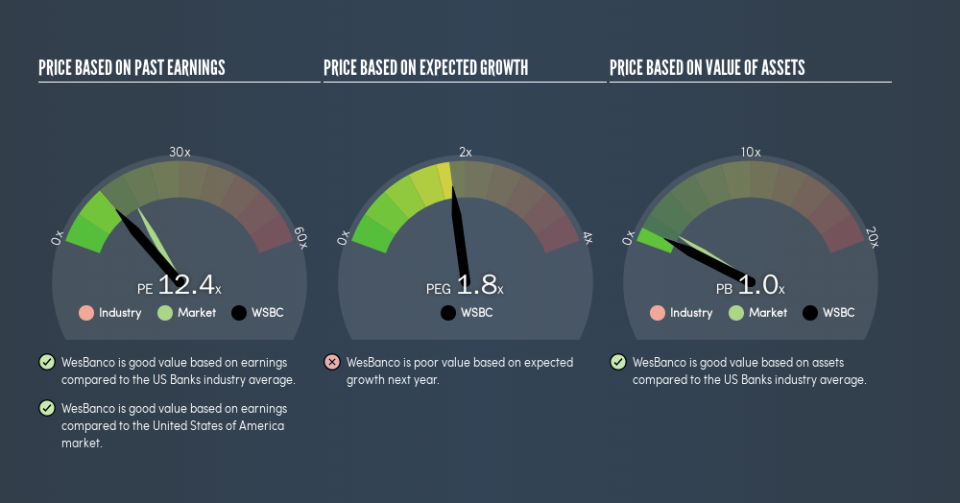
This article is for investors who would like to improve their understanding of price to earnings ratios (P/E ratios). We'll show how you can use WesBanco, Inc.'s (NASDAQ:WSBC) P/E ratio to inform your assessment of the investment opportunity. WesBanco has a P/E ratio of 12.4, based on the last twelve months. In other words, at today's prices, investors are paying $12.4 for every $1 in prior year profit.
View our latest analysis for WesBanco
How Do I Calculate A Price To Earnings Ratio?
The formula for P/E is:
Price to Earnings Ratio = Share Price ÷ Earnings per Share (EPS)
Or for WesBanco:
P/E of 12.4 = $36.07 ÷ $2.91 (Based on the year to March 2019.)
Is A High P/E Ratio Good?
The higher the P/E ratio, the higher the price tag of a business, relative to its trailing earnings. All else being equal, it's better to pay a low price -- but as Warren Buffett said, 'It's far better to buy a wonderful company at a fair price than a fair company at a wonderful price.'
How Growth Rates Impact P/E Ratios
P/E ratios primarily reflect market expectations around earnings growth rates. That's because companies that grow earnings per share quickly will rapidly increase the 'E' in the equation. That means even if the current P/E is high, it will reduce over time if the share price stays flat. So while a stock may look expensive based on past earnings, it could be cheap based on future earnings.
Notably, WesBanco grew EPS by a whopping 25% in the last year. And earnings per share have improved by 5.8% annually, over the last five years. So we'd generally expect it to have a relatively high P/E ratio.
Does WesBanco Have A Relatively High Or Low P/E For Its Industry?
The P/E ratio essentially measures market expectations of a company. As you can see below WesBanco has a P/E ratio that is fairly close for the average for the banks industry, which is 12.7.
That indicates that the market expects WesBanco will perform roughly in line with other companies in its industry. So if WesBanco actually outperforms its peers going forward, that should be a positive for the share price. Further research into factors such asmanagement tenure, could help you form your own view on whether that is likely.
Don't Forget: The P/E Does Not Account For Debt or Bank Deposits
Don't forget that the P/E ratio considers market capitalization. In other words, it does not consider any debt or cash that the company may have on the balance sheet. Hypothetically, a company could reduce its future P/E ratio by spending its cash (or taking on debt) to achieve higher earnings.
While growth expenditure doesn't always pay off, the point is that it is a good option to have; but one that the P/E ratio ignores.
WesBanco's Balance Sheet
Net debt totals 61% of WesBanco's market cap. If you want to compare its P/E ratio to other companies, you should absolutely keep in mind it has significant borrowings.
The Bottom Line On WesBanco's P/E Ratio
WesBanco's P/E is 12.4 which is below average (17.4) in the US market. The company has a meaningful amount of debt on the balance sheet, but that should not eclipse the solid earnings growth. If the company can continue to grow earnings, then the current P/E may be unjustifiably low.
When the market is wrong about a stock, it gives savvy investors an opportunity. If the reality for a company is not as bad as the P/E ratio indicates, then the share price should increase as the market realizes this. So this free visualization of the analyst consensus on future earnings could help you make the right decision about whether to buy, sell, or hold.
But note: WesBanco may not be the best stock to buy. So take a peek at this free list of interesting companies with strong recent earnings growth (and a P/E ratio below 20).
We aim to bring you long-term focused research analysis driven by fundamental data. Note that our analysis may not factor in the latest price-sensitive company announcements or qualitative material.
If you spot an error that warrants correction, please contact the editor at editorial-team@simplywallst.com. This article by Simply Wall St is general in nature. It does not constitute a recommendation to buy or sell any stock, and does not take account of your objectives, or your financial situation. Simply Wall St has no position in the stocks mentioned. Thank you for reading.
