The S&P 500 plunged 20% from its February 19 peak into a bear market in a record 16 trading days. Another seven sessions later, the S&P 500 was down more than 30% from that February closing high.
While the current market turmoil is without a doubt unprecedented, investors may find it worthwhile to consider how markets recovered from history’s other crashes.
Read more: How to think about stock investing: The full breakdown
“This is what market risk looks like,” Morningstar research director Paul Kaplan told Yahoo Finance. “We can go through some pretty severe downturns from time and time. And sometimes they can take a while to recover from. So that’s kind of in the nature of equity investing.”
“If you have the time and patience, you can still reap rewards from equity markets,” he added. “But it’s a very bumpy ride.”

A dollar to $15,303
A long-time horizon tends to be helpful. In Kaplan’s recent analysis of real U.S. stock returns, “$1 (in 1870 U.S. dollars) invested in a hypothetical U.S. stock market index in 1871 would have grown to $15,303 by the end of March 2020,” he said.
No single human investor has that kind of time to invest. But even looking more recently, an investor who’d bought at the stock market peak preceding the 2008-2009 financial crisis at the close of October 9, 2007 would still be up 43% on capital appreciation alone as of this year’s low on March 23.
Read more: Bull and bear markets: Everything you need to know
Those returns, however, would only have been realized if the investor had stomached the more than 50% stock market drop that transpired from the peak to the market bottom in March 2009.
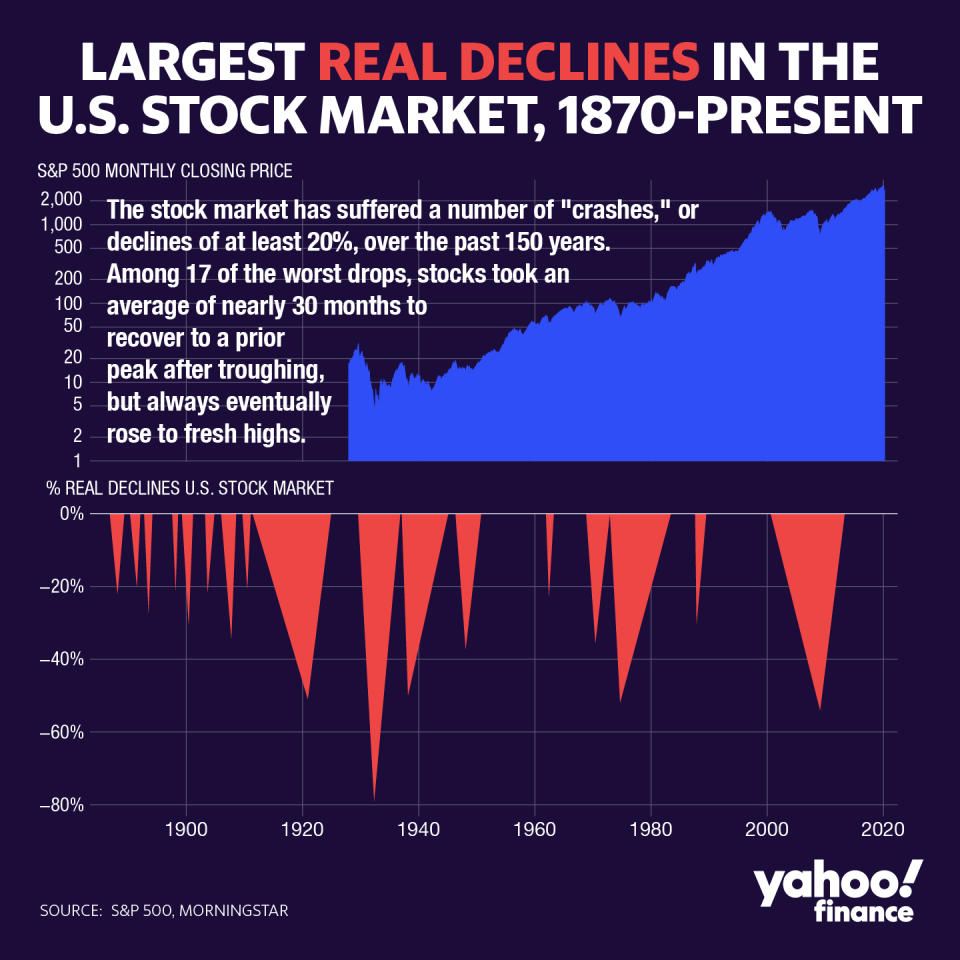
Kaplan’s look at 17 stock market crashes and ensuing bear markets – or periods after stocks fell 20% or more from a recent peak until recuperating those losses – highlights the turbulent life cycle equities lead as they move from initial drop to recovery. On average, stocks have entered bear markets about every nine years, he said.
Based on his data, stocks took an average of about 25 months to drop to a trough from a recent high. From the market bottom, stocks then averaged nearly 30 months to return back to at least the previous peak, designating a recovery.
The data points factoring into those averages, however, span a wide range. Historically, stocks took far longer to move from trough to recovery during periods when one calamity compounded with the cause of the initial equity shock, anchoring equities down from returning back to prior peaks.
Case in point – the longest trough to recovery period was 105 months, from the bottom in September 1974 to the recovery in mid-1983. Between that initial decline to the eventual recovery, investors endured a double-digit inflationary surge, a quadrupling of oil prices, conflict in the Middle East, and the resignation of President Richard Nixon over the Watergate scandal.
The shortest trough-to-recovery was just five months between March and August 1898, amid the outbreak of the Boer War in South Africa. In the past 50 years, the shortest trough-to-recovery was 20 months on the heels of 1987’s Black Monday.
Kaplan also developed a “pain index” to track the overall severity of each of the previous bear markets by accounting for both their initial real declines from peak to trough, as well as the time it took for the stock market to return back to the prior peak level. Each decline was benchmarked to the Great Depression – the worst stock market decline of the past 150 years based on both steepness of decline and time to recovery – with a pain score of 100.
Fitting the 2020 crash into this paradigm, the conclusion is unsurprising – the stock market drop 2020 was a top-ranking plunge based on the initial decline alone. The S&P 500 fell as much as 33.9% between its high on February 19 this year through the close on March 23.
“In terms of steepness, the current decline is serious—it roughly matches the initial sell-off during the crash of 1929,” Kaplan wrote in his analysis. “The other most severe episodes include the inflationary bear market during Vietnam/Watergate, the second half of the Great Depression/World War II, the Lost Decade, and the World War I/influenza pandemic downturn.”
‘Causality is actually going the other way’
As of closing prices Friday, the S&P 500 was up 28.5% from its closing low on March 23, but was still 17.8% short of its February 19 record closing high.
Both the contours – whether a straightforward V, slower U or wobbly W-shaped – and time to the market recovery coming out of the current COVID-19 crisis remain up for debate.
“How long and how deep it's going to be, we really don't know. And this one is unique in that ... its root cause is a pandemic, and because it is the actual economy itself pulling down the financial markets,” Kaplan said, nodding to the record levels of unemployment claims and historic plunges in retail sales shown in recent economic data.
In contrast, the last crash – the 2008 global financial crisis – “was reverse, where we had a financial crisis which caused an economic plunge,” he added. “Now we have an economic plunge caused by a virus causing a financial plunge. The causality is actually going the other way.”
In terms of economic recovery, an April 14 Bank of America Fund Managers Survey found the majority, or 52%, of those surveyed anticipated that the COVID-19 recovery will be U-shaped. Another 22% expected a W-shaped recovery for the economy, and another 15% saw a V-shaped rebound.
That the swift devastation of the coronavirus pandemic was met with a similarly speedy and far-reaching response from fiscal and monetary policymakers has also left many analysts more hopeful that the worst of the declines have already been stemmed.
“If recoveries are equal to recessions in duration and magnitude, then the output lost in the downturn will be fully recouped during the rebound and asset markets might retrace as quickly as they slumped. Hence, the always hoped for and almost always delivered V-shaped profile,” John Normand, JPMorgan Head of Cross Asset Fundamental Strategy, wrote in a recent note.
However, “if the recession inflicts longer-term damage to balance sheets or labor markets, then the recovery of lost income will be slower and so might be the rebound in corporate profits and asset prices,” he added. “Hence, the dreaded U.”
—
Emily McCormick is a reporter for Yahoo Finance. Follow her on Twitter: @emily_mcck
Read more from Emily:
Nike 3Q revenue tops expectations as surge in China digital sales helps offset store closures
Credit Suisse cuts 2020 S&P 500 outlook, but sees rebound in 2021
Markit U.S. PMI report signals 'steepest downturn since 2009 in March'
Follow Yahoo Finance on Twitter, Facebook, Instagram, Flipboard, LinkedIn, and reddit.
Find live stock market quotes and the latest business and finance news
