Where Gildan Activewear Inc.'s (TSE:GIL) Earnings Growth Stands Against Its Industry

Want to participate in a short research study? Help shape the future of investing tools and you could win a $250 gift card!
Improvement in profitability and outperformance against the industry can be important characteristics in a stock for some investors. Below, I will assess Gildan Activewear Inc.'s (TSE:GIL) track record on a high level, to give you some insight into how the company has been performing against its historical trend and its industry peers.
Check out our latest analysis for Gildan Activewear
Despite a decline, did GIL underperform the long-term trend and the industry?
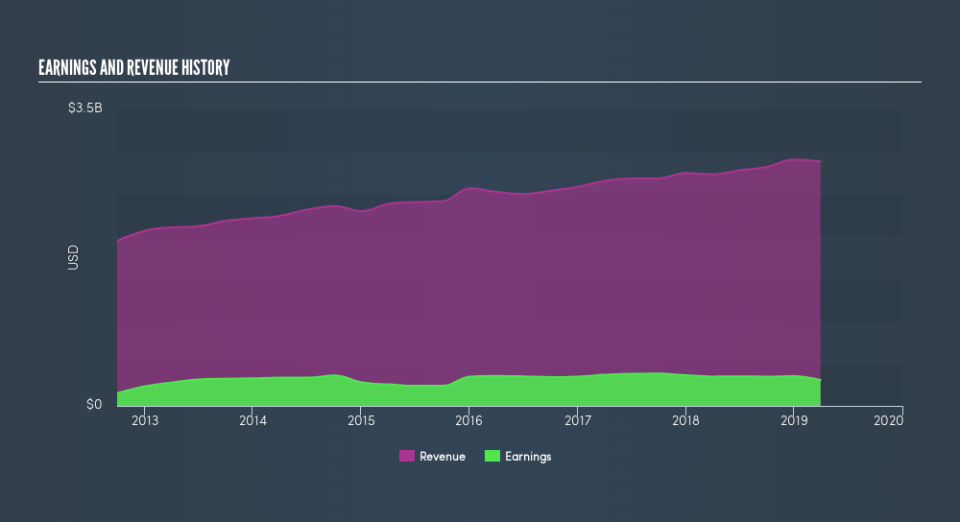
GIL's trailing twelve-month earnings (from 31 March 2019) of US$306m has declined by -12% compared to the previous year.
Furthermore, this one-year growth rate has been lower than its average earnings growth rate over the past 5 years of 3.4%, indicating the rate at which GIL is growing has slowed down. Why is this? Let's examine what's transpiring with margins and whether the whole industry is feeling the heat.
In terms of returns from investment, Gildan Activewear has fallen short of achieving a 20% return on equity (ROE), recording 16% instead. However, its return on assets (ROA) of 10% exceeds the CA Luxury industry of 7.7%, indicating Gildan Activewear has used its assets more efficiently. Though, its return on capital (ROC), which also accounts for Gildan Activewear’s debt level, has declined over the past 3 years from 14% to 14%. This correlates with an increase in debt holding, with debt-to-equity ratio rising from 8.1% to 49% over the past 5 years.
What does this mean?
Though Gildan Activewear's past data is helpful, it is only one aspect of my investment thesis. Generally companies that face an extended period of decline in earnings are undergoing some sort of reinvestment phase with the aim of keeping up with the latest industry expansion and disruption. You should continue to research Gildan Activewear to get a better picture of the stock by looking at:
Future Outlook: What are well-informed industry analysts predicting for GIL’s future growth? Take a look at our free research report of analyst consensus for GIL’s outlook.
Financial Health: Are GIL’s operations financially sustainable? Balance sheets can be hard to analyze, which is why we’ve done it for you. Check out our financial health checks here.
Other High-Performing Stocks: Are there other stocks that provide better prospects with proven track records? Explore our free list of these great stocks here.
NB: Figures in this article are calculated using data from the trailing twelve months from 31 March 2019. This may not be consistent with full year annual report figures.
We aim to bring you long-term focused research analysis driven by fundamental data. Note that our analysis may not factor in the latest price-sensitive company announcements or qualitative material.
If you spot an error that warrants correction, please contact the editor at editorial-team@simplywallst.com. This article by Simply Wall St is general in nature. It does not constitute a recommendation to buy or sell any stock, and does not take account of your objectives, or your financial situation. Simply Wall St has no position in the stocks mentioned. Thank you for reading.
