Where Photronics Inc (NASDAQ:PLAB) Stands In Terms Of Earnings Growth Against Its Industry

Measuring Photronics Inc’s (NASDAQ:PLAB) track record of past performance is an insightful exercise for investors. It enables us to reflect on whether the company has met or exceed expectations, which is a powerful signal for future performance. Below, I will assess PLAB’s recent performance announced on 29 April 2018 and compare these figures to its historical trend and industry movements. Check out our latest analysis for Photronics
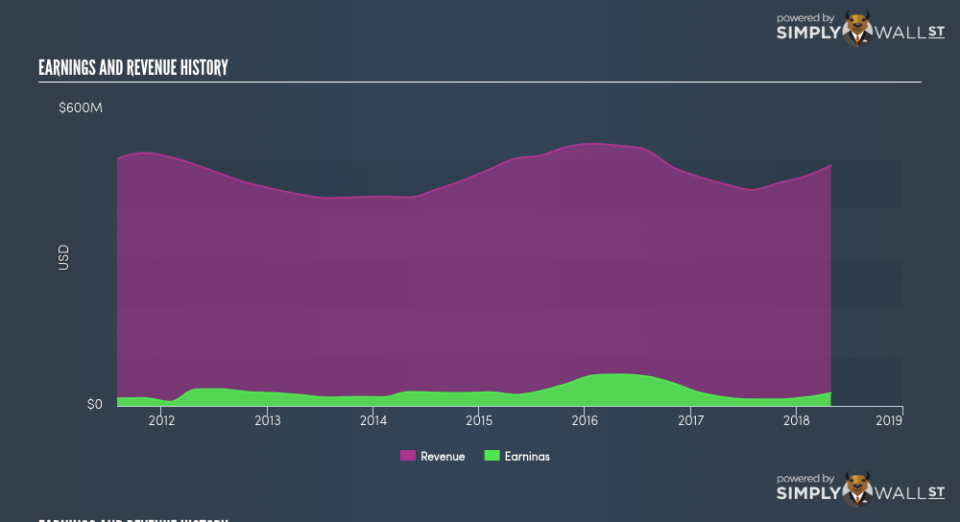
Could PLAB beat the long-term trend and outperform its industry?
PLAB’s trailing twelve-month earnings (from 29 April 2018) of US$25.95m has jumped 50.88% compared to the previous year. Furthermore, this one-year growth rate has exceeded its 5-year annual growth average of 6.09%, indicating the rate at which PLAB is growing has accelerated. What’s enabled this growth? Let’s take a look at if it is solely attributable to industry tailwinds, or if Photronics has seen some company-specific growth.
In the past few years, Photronics increased its bottom line faster than revenue by efficiently controlling its costs. This has led to a margin expansion and profitability over time. Scanning growth from a sector-level, the US semiconductor industry has been growing its average earnings by double-digit 28.19% over the prior year, and 13.91% over the previous five years. This shows that any tailwind the industry is profiting from, Photronics is able to amplify this to its advantage.
In terms of returns from investment, Photronics has not invested its equity funds well, leading to a 4.35% return on equity (ROE), below the sensible minimum of 20%. Furthermore, its return on assets (ROA) of 2.36% is below the US Semiconductor industry of 7.88%, indicating Photronics’s are utilized less efficiently. And finally, its return on capital (ROC), which also accounts for Photronics’s debt level, has declined over the past 3 years from 4.70% to 4.69%.
What does this mean?
While past data is useful, it doesn’t tell the whole story. Recent positive growth doesn’t necessarily mean it’s onwards and upwards for the company. There could be factors that are influencing the entire industry hence the high industry growth rate over the same time period. I recommend you continue to research Photronics to get a more holistic view of the stock by looking at:
Future Outlook: What are well-informed industry analysts predicting for PLAB’s future growth? Take a look at our free research report of analyst consensus for PLAB’s outlook.
Financial Health: Is PLAB’s operations financially sustainable? Balance sheets can be hard to analyze, which is why we’ve done it for you. Check out our financial health checks here.
Other High-Performing Stocks: Are there other stocks that provide better prospects with proven track records? Explore our free list of these great stocks here.
NB: Figures in this article are calculated using data from the trailing twelve months from 29 April 2018. This may not be consistent with full year annual report figures.
To help readers see pass the short term volatility of the financial market, we aim to bring you a long-term focused research analysis purely driven by fundamental data. Note that our analysis does not factor in the latest price sensitive company announcements.
The author is an independent contributor and at the time of publication had no position in the stocks mentioned.
