Why is the Australian Dollar Falling and Why Might it Fall Further?
Summary: The Australian Dollar has fallen to 11-month lows despite record-highs in the S&P 500. Why has it fallen and—more importantly—why do we think it could fall further?
The Australian Dollar has tumbled to 11-month lows despite record-highs in the US S&P 500—what gives?
We’ve previously highlighted the fact that the AUDUSD typically trades quite closely to stock market prices and broader risky asset classes. Yet recent S&P gains haven’t been enough to forestall a sizeable Aussie Dollar sell-off. The chart below helps explain the breakdown in the correlation between the AUD and S&P.
Australian Dollar Plotted Against Relative Moves in S&P 500, Gold, Yields
Data source: Bloomberg, Chart source: R
If we take a close look at the Aussie currency’s link to stocks, we see that it has grown far less important in the past year. The weakening AUDUSD/S&P 500 correlation coincides with a substantial decline in Australian Government bond yields, and we don’t think that’s a coincidence.
The Australian Dollar has consistently boasted the highest short-term deposit rates of any G10 currency since Q2, 2009, a time which also roughly lines up with a substantial AUDUSD and S&P 500 low.
The same risk-seeking behavior that encourages traders to shed safer assets in favor of higher-risk/higher-return S&P 500 stocks almost certainly drives speculators to buy the Australian Dollar versus the historical safe-haven and low-yielding US Dollar.
The material breakdown in the S&P 500/Aussie correlation can subsequently be explained in terms of yields—the AUDUSD simply doesn’t offer the same interest rate differential it once did. We’re left with a correlation that actually trades near multi-year peaks.
Australian Dollar Correlation to the 2-Year Australian Government Bond Yield, 1994-2013
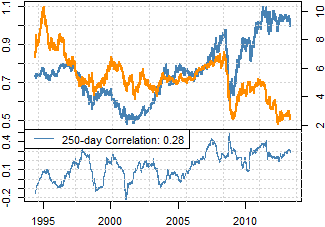
Australian Dollar/US Dollar Exchange Rate (lhs)
2-Year Australian Government Bond Yield (rhs)
Data source: Bloomberg, Chart source: R
The year-long correlation between the AUDUSD and Aussie yields trades helps explain the Asia-Pacific currency’s break from the S&P 500. This dynamic has fairly significant implications for Australian Dollar forecasts: further declines in domestic yields could force AUD weakness regardless of what’s going on in the S&P and broader ‘risk’ markets.
Our technical analysis-based Australian Dollar forecast similarly favors further weakness as it breaks to 11-month lows. Data on retail forex trader positions paints a similarly bearish picture; our sentiment-based forex trading strategies remain aggressively short the AUDUSD.
Explore our Sentiment-Based Trading Signals on DailyFX PLUS
Retail Speculators Near Their Most Long Australian Dollar on Record
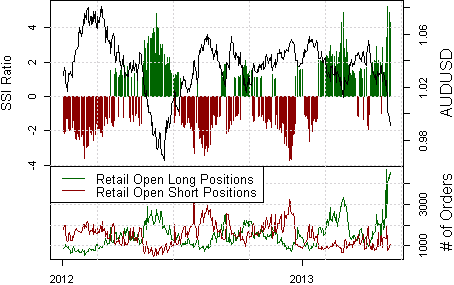
Data source: FXCM Execution Desk, Chart source: R
Our proprietary Speculative Sentiment Index data shows retail FX traders recently hit their most long the Australian Dollar against the US Dollar on record, and indeed sentiment remains extremely one-sided.
We remain steadfast in our calls for further Australian Dollar weakness. Though it’s certainly worth noting that such one-sided extremes often coincide with important currency price extremes (i.e. tops/bottoms).
The fact that the Australian Dollar is now at its longest consecutive daily decline in 8 years warns that short-term corrections higher are not only possible but likely.
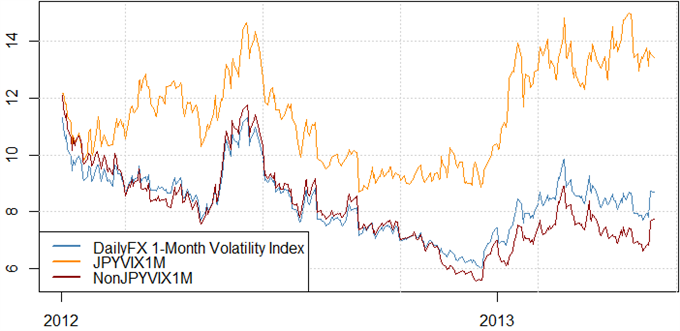
Yet elevated forex market volatility prices show that professional traders are betting on and/or hedging against big US Dollar moves versus the Aussie and other counterparts.
We remain plainly in favor of selling into AUDUSD weakness until further notice.
Forex Correlations Summary
View forex correlations to the S&P 500, S&P Volatility Index (VIX), Crude Oil Futures prices, US 2-Year Treasury Yields, and Spot Gold prices.
US S&P 500 | EURUSD | GBPUSD | USDJPY | AUDUSD | USDCAD | NZDUSD | USDOLLAR |
1 Week | 0.65 | 0.40 | -0.39 | 0.48 | -0.54 | -0.84 | -0.55 |
1 Month | 0.45 | 0.33 | 0.44 | 0.74 | -0.71 | 0.67 | -0.36 |
3 Month | 0.46 | 0.17 | 0.42 | 0.58 | -0.60 | 0.50 | -0.22 |
1 Year | 0.46 | 0.38 | 0.28 | 0.61 | -0.69 | 0.60 | -0.42 |
Gold | EURUSD | GBPUSD | USDJPY | AUDUSD | USDCAD | NZDUSD | USDOLLAR |
1 Week | 0.83 | 0.92 | -0.52 | 0.92 | -0.67 | -0.13 | -0.82 |
1 Month | 0.36 | 0.45 | 0.44 | 0.74 | -0.72 | 0.75 | -0.36 |
3 Month | 0.16 | 0.34 | 0.23 | 0.50 | -0.44 | 0.49 | -0.24 |
1 Year | 0.32 | 0.34 | 0.01 | 0.42 | -0.35 | 0.41 | -0.40 |
Crude Oil | EURUSD | GBPUSD | USDJPY | AUDUSD | USDCAD | NZDUSD | USDOLLAR |
1 Week | 0.60 | 0.74 | -0.13 | 0.67 | -0.59 | -0.11 | -0.53 |
1 Month | 0.19 | 0.48 | 0.26 | 0.66 | -0.51 | 0.65 | -0.36 |
3 Month | 0.20 | 0.25 | 0.11 | 0.54 | -0.47 | 0.48 | -0.30 |
1 Year | 0.43 | 0.38 | 0.13 | 0.52 | -0.58 | 0.47 | -0.45 |
US 2yr Yld | EURUSD | GBPUSD | USDJPY | AUDUSD | USDCAD | NZDUSD | USDOLLAR |
1 Week | -0.25 | -0.48 | 0.36 | -0.28 | 0.31 | -0.77 | 0.33 |
1 Month | 0.14 | -0.16 | 0.62 | 0.30 | -0.12 | 0.16 | 0.13 |
3 Month | 0.30 | 0.01 | 0.48 | 0.25 | -0.18 | 0.11 | 0.04 |
1 Year | 0.23 | 0.06 | 0.37 | 0.18 | -0.23 | 0.08 | -0.02 |
S&P VIX | EURUSD | GBPUSD | USDJPY | AUDUSD | USDCAD | NZDUSD | USDOLLAR |
1 Week | -0.42 | -0.09 | 0.30 | -0.23 | 0.29 | 0.91 | 0.34 |
1 Month | -0.46 | -0.30 | -0.55 | -0.70 | 0.68 | -0.67 | 0.29 |
3 Month | -0.50 | -0.17 | -0.45 | -0.52 | 0.57 | -0.46 | 0.19 |
1 Year | -0.38 | -0.28 | -0.29 | -0.52 | 0.56 | -0.54 | 0.32 |
Perfect Positive Correlation: | 1.00 | ||||||
Perfect Negative Correlation: | -1.00 | ||||||
--- Written by David Rodriguez, Quantitative Strategist for DailyFX.com
Receive future special reports on the Australian Dollar and other studies via this author’s e-mail distribution list with this link.
David specializes in automated trading strategies. Find out more about our automated sentiment-based strategies on DailyFX PLUS.
Contact and follow David via Twitter: https://twitter.com/DRodriguezFX
http://www.dailyfx.com/forex/fundamental/article/weekly_strategy_outlook/2013/05/13/forex_strategy_us_dollar_outlook_calls_for_gains.html
DailyFX provides forex news and technical analysis on the trends that influence the global currency markets.
Learn forex trading with a free practice account and trading charts from FXCM.
