Why Big Yellow Group Plc (LON:BYG) Looks Like A Quality Company

One of the best investments we can make is in our own knowledge and skill set. With that in mind, this article will work through how we can use Return On Equity (ROE) to better understand a business. By way of learning-by-doing, we’ll look at ROE to gain a better understanding of Big Yellow Group Plc (LON:BYG).
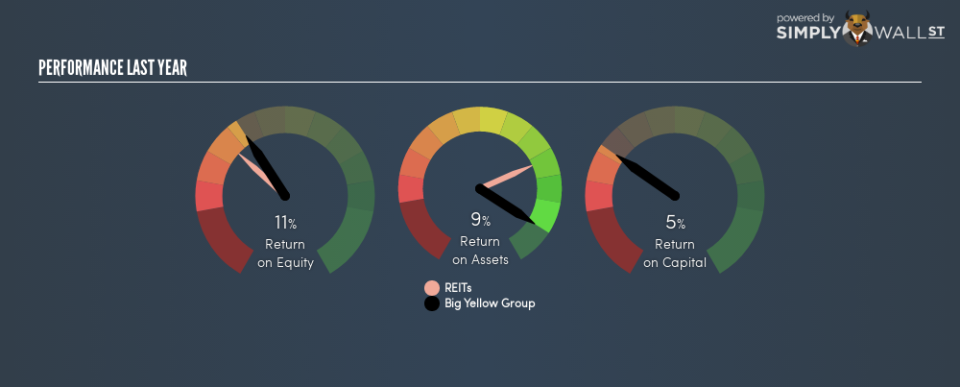
Big Yellow Group has a ROE of 11%, based on the last twelve months. One way to conceptualize this, is that for each £1 of shareholders’ equity it has, the company made £0.11 in profit.
See our latest analysis for Big Yellow Group
Want to help shape the future of investing tools and platforms? Take the survey and be part of one of the most advanced studies of stock market investors to date.
How Do You Calculate ROE?
The formula for ROE is:
Return on Equity = Net Profit ÷ Shareholders’ Equity
Or for Big Yellow Group:
11% = 116.298 ÷ UK£1.1b (Based on the trailing twelve months to September 2018.)
It’s easy to understand the ‘net profit’ part of that equation, but ‘shareholders’ equity’ requires further explanation. It is the capital paid in by shareholders, plus any retained earnings. Shareholders’ equity can be calculated by subtracting the total liabilities of the company from the total assets of the company.
What Does Return On Equity Mean?
ROE measures a company’s profitability against the profit it retains, and any outside investments. The ‘return’ is the amount earned after tax over the last twelve months. The higher the ROE, the more profit the company is making. So, all else equal, investors should like a high ROE. That means it can be interesting to compare the ROE of different companies.
Does Big Yellow Group Have A Good Return On Equity?
One simple way to determine if a company has a good return on equity is to compare it to the average for its industry. The limitation of this approach is that some companies are quite different from others, even within the same industry classification. As is clear from the image below, Big Yellow Group has a better ROE than the average (8.4%) in the REITs industry.
That’s clearly a positive. I usually take a closer look when a company has a better ROE than industry peers. For example, I often check if insiders have been buying shares .
The Importance Of Debt To Return On Equity
Companies usually need to invest money to grow their profits. The cash for investment can come from prior year profits (retained earnings), issuing new shares, or borrowing. In the first two cases, the ROE will capture this use of capital to grow. In the latter case, the debt used for growth will improve returns, but won’t affect the total equity. Thus the use of debt can improve ROE, albeit along with extra risk in the case of stormy weather, metaphorically speaking.
Big Yellow Group’s Debt And Its 11% ROE
Big Yellow Group has a debt to equity ratio of 0.27, which is far from excessive. The combination of modest debt and a very respectable ROE suggests this is a business worth watching. Conservative use of debt to boost returns is usually a good move for shareholders, though it does leave the company more exposed to interest rate rises.
The Key Takeaway
Return on equity is one way we can compare the business quality of different companies. In my book the highest quality companies have high return on equity, despite low debt. If two companies have around the same level of debt to equity, and one has a higher ROE, I’d generally prefer the one with higher ROE.
But when a business is high quality, the market often bids it up to a price that reflects this. The rate at which profits are likely to grow, relative to the expectations of profit growth reflected in the current price, must be considered, too. So you might want to take a peek at this data-rich interactive graph of forecasts for the company.
Of course, you might find a fantastic investment by looking elsewhere. So take a peek at this free list of interesting companies.
To help readers see past the short term volatility of the financial market, we aim to bring you a long-term focused research analysis purely driven by fundamental data. Note that our analysis does not factor in the latest price-sensitive company announcements.
The author is an independent contributor and at the time of publication had no position in the stocks mentioned. For errors that warrant correction please contact the editor at editorial-team@simplywallst.com.
