Why Brown & Brown, Inc. (NYSE:BRO) Is A Dividend Rockstar

Want to participate in a short research study? Help shape the future of investing tools and you could win a $250 gift card!
Today we'll take a closer look at Brown & Brown, Inc. (NYSE:BRO) from a dividend investor's perspective. Owning a strong business and reinvesting the dividends is widely seen as an attractive way of growing your wealth. Unfortunately, it's common for investors to be enticed in by the seemingly attractive yield, and lose money when the company has to cut its dividend payments.
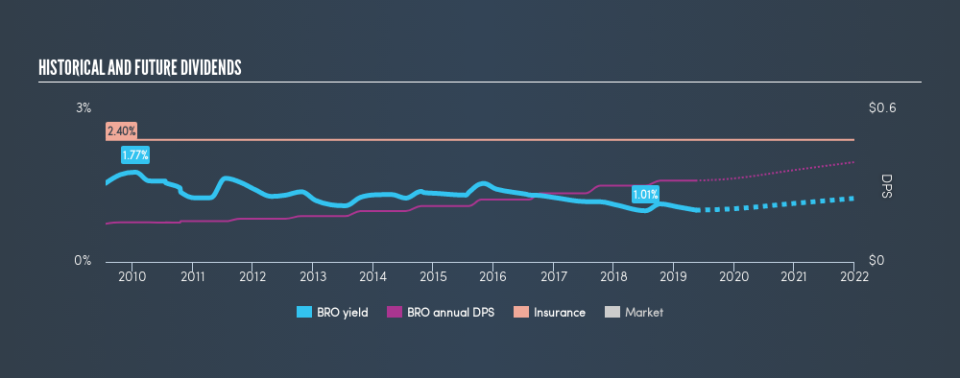
While Brown & Brown's 1.0% dividend yield is not the highest, we think its lengthy payment history is quite interesting. The company also bought back stock during the year, equivalent to approximately 0.9% of the company's market capitalisation at the time. There are a few simple ways to reduce the risks of buying Brown & Brown for its dividend, and we'll go through these below.
Click the interactive chart for our full dividend analysis
Payout ratios
Companies (usually) pay dividends out of their earnings. If a company is paying more than it earns, the dividend might have to be cut. So we need to be form a view on if a company's dividend is sustainable, relative to its net profit after tax. In the last year, Brown & Brown paid out 23% of its profit as dividends. With a low payout ratio, it looks like the dividend is comprehensively covered by earnings.
We also measure dividends paid against a company's levered free cash flow, to see if enough cash was generated to cover the dividend. Brown & Brown's cash payout ratio last year was 19%, which is quite low and suggests that the dividend was thoroughly covered by cash flow.
Is Brown & Brown's Balance Sheet Risky?
As Brown & Brown has a meaningful amount of debt, we need to check its balance sheet to see if the company might have debt risks. A quick way to check a company's financial situation uses these two ratios: net debt divided by EBITDA (earnings before interest, tax, depreciation and amortisation), and net interest cover. Net debt to EBITDA is a measure of a company's total debt. Net interest cover measures the ability to meet interest payments on debt. Essentially we check that a) a company does not have too much debt, and b) that it can afford to pay the interest. Brown & Brown has net debt of 2.03 times its earnings before interest, tax, depreciation, and amortisation (EBITDA). Using debt can accelerate business growth, but also increases the risks.
We calculated its interest cover by measuring its earnings before interest and tax (EBIT), and dividing this by the company's net interest expense. With EBIT of 12.51 times its interest expense, Brown & Brown's interest cover is quite strong - more than enough to cover the interest expense.
Consider getting our latest analysis on Brown & Brown's financial position here.
Dividend Volatility
One of the major risks of relying on dividend income, is the potential for a company to struggle financially and cut its dividend. Not only is your income cut, but the value of your investment declines as well - nasty. For the purpose of this article, we only scrutinise the last decade of Brown & Brown's dividend payments. The dividend has been stable over the past 10 years, which is great. We think this could suggest some resilience to the business and its dividends. During the past ten-year period, the first annual payment was US$0.15 in 2009, compared to US$0.32 last year. Dividends per share have grown at approximately 7.9% per year over this time.
Dividend Growth Potential
Dividend payments have been consistent over the past few years, but we should always check if earnings per share (EPS) are growing, as this will help maintain the purchasing power of the dividend. It's good to see Brown & Brown has been growing its earnings per share at 12% a year over the past 5 years. Rapid earnings growth and a low payout ratio suggests this company has been effectively reinvesting in its business. Should that continue, this company could have a bright future.
Conclusion
Dividend investors should always want to know if a) a company's dividends are affordable, b) if there is a track record of consistent payments, and c) if the dividend is capable of growing. Firstly, we like that Brown & Brown has low and conservative payout ratios. That said, we were glad to see it growing earnings and paying a fairly consistent dividend. All these things considered, we think this organisation has a lot going for it from a dividend perspective.
Companies that are growing earnings tend to be the best dividend stocks over the long term. See what the 9 analysts we track are forecasting for Brown & Brown for free with public analyst estimates for the company.
We have also put together a list of global stocks with a market capitalisation above $1bn and yielding more 3%.
We aim to bring you long-term focused research analysis driven by fundamental data. Note that our analysis may not factor in the latest price-sensitive company announcements or qualitative material.
If you spot an error that warrants correction, please contact the editor at editorial-team@simplywallst.com. This article by Simply Wall St is general in nature. It does not constitute a recommendation to buy or sell any stock, and does not take account of your objectives, or your financial situation. Simply Wall St has no position in the stocks mentioned. Thank you for reading.
