Why Is Cabot Oil & Gas (COG) Down 1.6% Since its Last Earnings Report?

A month has gone by since the last earnings report for Cabot Oil & Gas Corporation COG. Shares have lost about 1.6% in that time frame.
Will the recent negative trend continue leading up to its next earnings release, or is COG due for a breakout? Before we dive into how investors and analysts have reacted as of late, let's take a quick look at its most recent earnings report in order to get a better handle on the important drivers.
Fourth-Quarter 2017 Results
Cabot reported fourth quarter earnings per share – adjusted for special items – of 13 cents, slightly above the Zacks Consensus Estimate of 12 cents and in line with the year-ago quarter profit.
The exploration and production firm’s results were buoyed by higher production and realized prices.
Houston, TX-based Cabot’s quarterly revenue improved 26.5% year-over-year to $400.5 million but missed the Zacks Consensus Estimate of $426 million.
Volume Analysis
Cabot’s overall production during the quarter totaled 172.6 billion cubic feet equivalent (Bcfe) – 95% gas – up 5.1% from the prior year quarter volume of 164.2 Bcfe. Natural gas output was 164.4 Bcf, while liquids production came in at 1,369.5 thousand barrels (MBbl).
Realized Prices
The average realized natural gas price increased 12.4% from the year-ago quarter to $2.18 per thousand cubic feet, while average crude/condensate price realization rose 27% to $54.54 per barrel. Meanwhile, natural gas liquids fetched $23.51 per barrel as against $13.84 a year back.
Costs & Expenses
Total operating expenses were 1.5% lower than the fourth quarter of 2016, declining to $744.7 million. While transportation and gathering costs were up 5.2% year-over-year to $119.5 million, oil and gas property write-offs fell 4.9% to $414.3 million. Meanwhile, Cabot’s depreciation, depletion and amortization expenses edged up 1.4% from the year-ago period to $143.1 million.
Drilling Statistics, Capital Expenditure & Balance Sheet
Cabot drilled 20 net wells and completed 24 during the quarter. Operating cash flows were $179.1 million for the quarter (up 28.2% year over year), while capital expenditures totaled $177.7 million (up 36.6%). As of Dec 31, 2017, the company had $1,521.9 million in long-term debt (excluding current portion), with a debt-to-capitalization ratio of 37.6%.
Proved Reserves
As of year-end 2017, Cabot had 9.7 trillion cubic feet equivalent in proved reserves (96% natural gas).
How Have Estimates Been Moving Since Then?
In the past month, investors have witnessed a downward trend in fresh estimates. There have been two revisions lower for the current quarter.
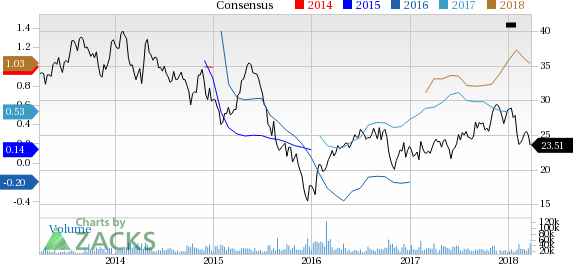
Cabot Oil & Gas Corporation Price and Consensus
Cabot Oil & Gas Corporation Price and Consensus | Cabot Oil & Gas Corporation Quote
VGM Scores
At this time, COG has an average Growth Score of C, though it is lagging a bit on the momentum front with a D. Charting a somewhat similar path, the stock was allocated a grade of C on the value side, putting it in the middle 20% for this investment strategy.
Overall, the stock has an aggregate VGM Score of D. If you aren't focused on one strategy, this score is the one you should be interested in.
Zacks' style scores indicate that the company's stock is suitable for value and growth investors.
Outlook
Estimates have been broadly trending downward for the stock and the magnitude of these revisions indicates a downward shift. It's no surprise COG has a Zacks Rank #4 (Sell). We expect a below average return from the stock in the next few months.
Want the latest recommendations from Zacks Investment Research? Today, you can download 7 Best Stocks for the Next 30 Days. Click to get this free report
Cabot Oil & Gas Corporation (COG) : Free Stock Analysis Report
To read this article on Zacks.com click here.
Zacks Investment Research
