Why Caleres Inc (CAL) May Not Be As Efficient As Its Industry

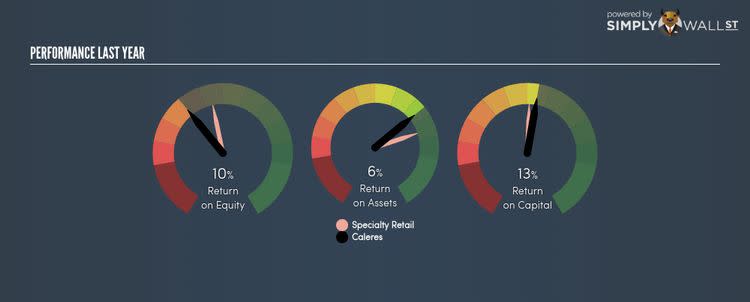
Caleres Inc (NYSE:CAL) generated a below-average return on equity of 9.73% in the past 12 months, while its industry returned 14.10%. Though CAL’s recent performance is underwhelming, it is useful to understand what ROE is made up of and how it should be interpreted. Knowing these components can change your views on CAL’s below-average returns. I will take you through how metrics such as financial leverage impact ROE which may affect the overall sustainability of CAL’s returns. Check out our latest analysis for Caleres
Breaking down Return on Equity
Return on Equity (ROE) is a measure of CAL’s profit relative to its shareholders’ equity. It essentially shows how much CAL can generate in earnings given the amount of equity it has raised. While a higher ROE is preferred in most cases, there are several other factors we should consider before drawing any conclusions.
Return on Equity = Net Profit ÷ Shareholders Equity
Returns are usually compared to costs to measure the efficiency of capital. CAL’s cost of equity is 10.61%. This means CAL’s returns actually do not cover its own cost of equity, with a discrepancy of -0.88%. This isn’t sustainable as it implies, very simply, that the company pays more for its capital than what it generates in return. ROE can be split up into three useful ratios: net profit margin, asset turnover, and financial leverage. This is called the Dupont Formula:
Dupont Formula
ROE = profit margin × asset turnover × financial leverage
ROE = (annual net profit ÷ sales) × (sales ÷ assets) × (assets ÷ shareholders’ equity)
ROE = annual net profit ÷ shareholders’ equity
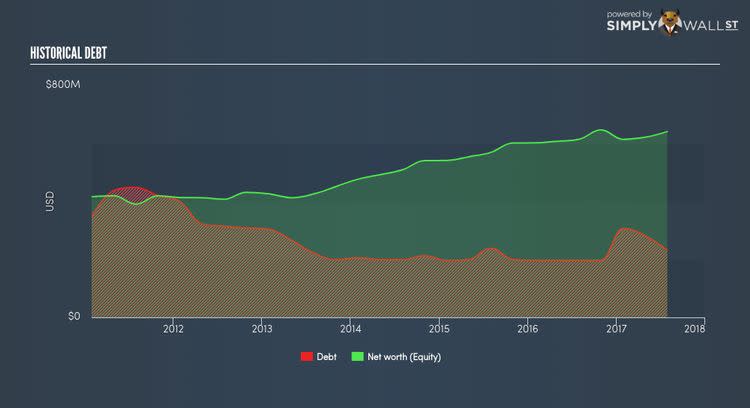
Basically, profit margin measures how much of revenue trickles down into earnings which illustrates how efficient CAL is with its cost management. Asset turnover shows how much revenue CAL can generate with its current asset base. And finally, financial leverage is simply how much of assets are funded by equity, which exhibits how sustainable CAL’s capital structure is. Since financial leverage can artificially inflate ROE, we need to look at how much debt CAL currently has. At 36.22%, CAL’s debt-to-equity ratio appears low and indicates that CAL still has room to increase leverage and grow its profits.
What this means for you:
Are you a shareholder? CAL’s below-industry ROE is disappointing, furthermore, its returns were not even high enough to cover its own cost of equity. However, investors shouldn’t despair since ROE is not inflated by excessive debt, which means CAL still has room to improve shareholder returns by raising debt to fund new investments. If you’re looking for new ideas for high-returning stocks, you should take a look at our free platform to see the list of stocks with Return on Equity over 20%.
Are you a potential investor? If you are considering investing in CAL, basing your decision on ROE alone is certainly not sufficient. I recommend you do additional fundamental analysis by looking through our most recent infographic report on Caleres to help you make a more informed investment decision.
To help readers see pass the short term volatility of the financial market, we aim to bring you a long-term focused research analysis purely driven by fundamental data. Note that our analysis does not factor in the latest price sensitive company announcements.
The author is an independent contributor and at the time of publication had no position in the stocks mentioned.
