Why Capitol Federal Financial, Inc.'s (NASDAQ:CFFN) High P/E Ratio Isn't Necessarily A Bad Thing

The goal of this article is to teach you how to use price to earnings ratios (P/E ratios). To keep it practical, we'll show how Capitol Federal Financial, Inc.'s (NASDAQ:CFFN) P/E ratio could help you assess the value on offer. Based on the last twelve months, Capitol Federal Financial's P/E ratio is 19.77. That is equivalent to an earnings yield of about 5.1%.
Want to participate in a short research study? Help shape the future of investing tools and you could win a $250 gift card!
Check out our latest analysis for Capitol Federal Financial
How Do You Calculate A P/E Ratio?
The formula for P/E is:
Price to Earnings Ratio = Price per Share ÷ Earnings per Share (EPS)
Or for Capitol Federal Financial:
P/E of 19.77 = $13.44 ÷ $0.68 (Based on the trailing twelve months to March 2019.)
Is A High Price-to-Earnings Ratio Good?
The higher the P/E ratio, the higher the price tag of a business, relative to its trailing earnings. That is not a good or a bad thing per se, but a high P/E does imply buyers are optimistic about the future.
How Growth Rates Impact P/E Ratios
Earnings growth rates have a big influence on P/E ratios. If earnings are growing quickly, then the 'E' in the equation will increase faster than it would otherwise. And in that case, the P/E ratio itself will drop rather quickly. And as that P/E ratio drops, the company will look cheap, unless its share price increases.
Capitol Federal Financial's earnings per share fell by 5.9% in the last twelve months. But it has grown its earnings per share by 6.2% per year over the last five years.
How Does Capitol Federal Financial's P/E Ratio Compare To Its Peers?
We can get an indication of market expectations by looking at the P/E ratio. As you can see below, Capitol Federal Financial has a higher P/E than the average company (14.2) in the mortgage industry.
Capitol Federal Financial's P/E tells us that market participants think the company will perform better than its industry peers, going forward. Shareholders are clearly optimistic, but the future is always uncertain. So investors should always consider the P/E ratio alongside other factors, such as whether company directors have been buying shares.
Don't Forget: The P/E Does Not Account For Debt or Bank Deposits
It's important to note that the P/E ratio considers the market capitalization, not the enterprise value. So it won't reflect the advantage of cash, or disadvantage of debt. In theory, a company can lower its future P/E ratio by using cash or debt to invest in growth.
Spending on growth might be good or bad a few years later, but the point is that the P/E ratio does not account for the option (or lack thereof).
So What Does Capitol Federal Financial's Balance Sheet Tell Us?
Net debt totals a substantial 112% of Capitol Federal Financial's market cap. This level of debt justifies a relatively low P/E, so remain cognizant of the debt, if you're comparing it to other stocks.
The Verdict On Capitol Federal Financial's P/E Ratio
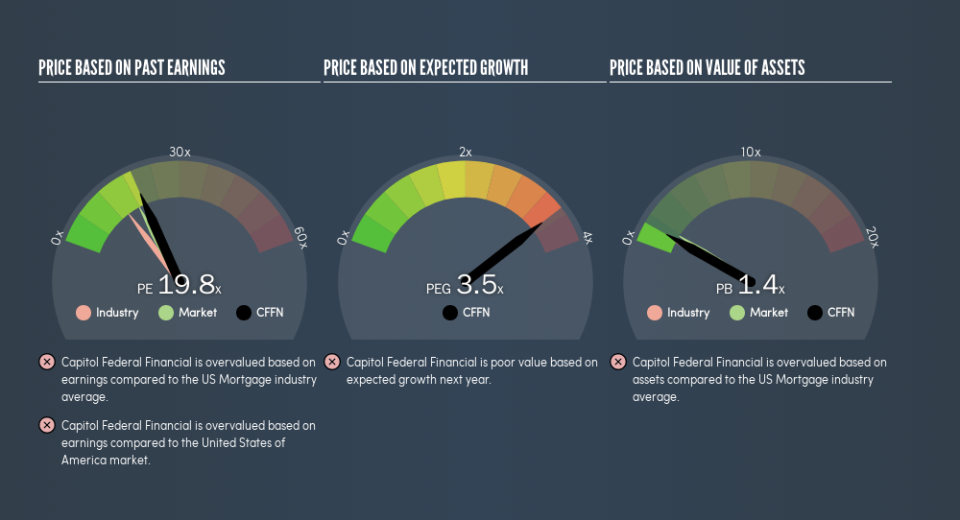
Capitol Federal Financial trades on a P/E ratio of 19.8, which is above the US market average of 17.7. With meaningful debt and a lack of recent earnings growth, the market has high expectations that the business will earn more in the future.
Investors should be looking to buy stocks that the market is wrong about. As value investor Benjamin Graham famously said, 'In the short run, the market is a voting machine but in the long run, it is a weighing machine.' So this free visualization of the analyst consensus on future earnings could help you make the right decision about whether to buy, sell, or hold.
You might be able to find a better buy than Capitol Federal Financial. If you want a selection of possible winners, check out this free list of interesting companies that trade on a P/E below 20 (but have proven they can grow earnings).
We aim to bring you long-term focused research analysis driven by fundamental data. Note that our analysis may not factor in the latest price-sensitive company announcements or qualitative material.
If you spot an error that warrants correction, please contact the editor at editorial-team@simplywallst.com. This article by Simply Wall St is general in nature. It does not constitute a recommendation to buy or sell any stock, and does not take account of your objectives, or your financial situation. Simply Wall St has no position in the stocks mentioned. Thank you for reading.
