Why You Should Care About Acerinox, S.A.’s (BME:ACX) Low Return On Capital

Today we are going to look at Acerinox, S.A. (BME:ACX) to see whether it might be an attractive investment prospect. Specifically, we'll consider its Return On Capital Employed (ROCE), since that will give us an insight into how efficiently the business can generate profits from the capital it requires.
First of all, we'll work out how to calculate ROCE. Next, we'll compare it to others in its industry. Finally, we'll look at how its current liabilities affect its ROCE.
What is Return On Capital Employed (ROCE)?
ROCE measures the 'return' (pre-tax profit) a company generates from capital employed in its business. In general, businesses with a higher ROCE are usually better quality. Ultimately, it is a useful but imperfect metric. Author Edwin Whiting says to be careful when comparing the ROCE of different businesses, since 'No two businesses are exactly alike.
How Do You Calculate Return On Capital Employed?
The formula for calculating the return on capital employed is:
Return on Capital Employed = Earnings Before Interest and Tax (EBIT) ÷ (Total Assets - Current Liabilities)
Or for Acerinox:
0.068 = €226m ÷ (€4.7b - €1.4b) (Based on the trailing twelve months to June 2019.)
So, Acerinox has an ROCE of 6.8%.
View our latest analysis for Acerinox
Is Acerinox's ROCE Good?
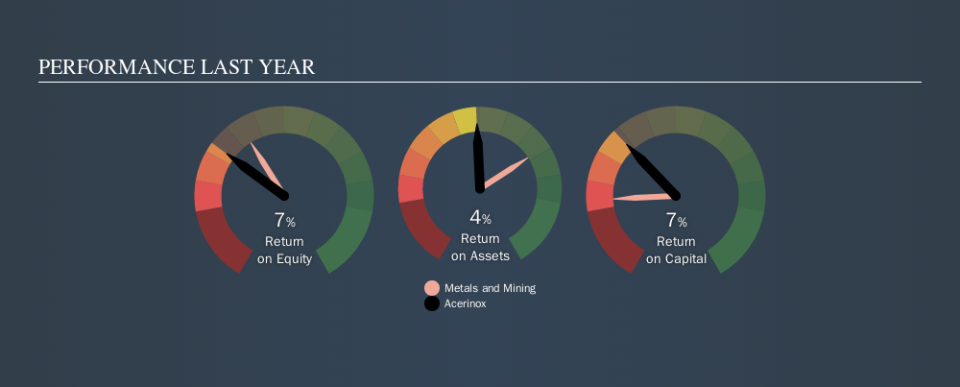
When making comparisons between similar businesses, investors may find ROCE useful. We can see Acerinox's ROCE is meaningfully below the Metals and Mining industry average of 9.2%. This performance could be negative if sustained, as it suggests the business may underperform its industry. Aside from the industry comparison, Acerinox's ROCE is mediocre in absolute terms, considering the risk of investing in stocks versus the safety of a bank account. Investors may wish to consider higher-performing investments.
In our analysis, Acerinox's ROCE appears to be 6.8%, compared to 3 years ago, when its ROCE was 0.9%. This makes us wonder if the company is improving. You can click on the image below to see (in greater detail) how Acerinox's past growth compares to other companies.
When considering this metric, keep in mind that it is backwards looking, and not necessarily predictive. Companies in cyclical industries can be difficult to understand using ROCE, as returns typically look high during boom times, and low during busts. ROCE is, after all, simply a snap shot of a single year. Remember that most companies like Acerinox are cyclical businesses. Since the future is so important for investors, you should check out our free report on analyst forecasts for Acerinox.
Acerinox's Current Liabilities And Their Impact On Its ROCE
Current liabilities include invoices, such as supplier payments, short-term debt, or a tax bill, that need to be paid within 12 months. Due to the way the ROCE equation works, having large bills due in the near term can make it look as though a company has less capital employed, and thus a higher ROCE than usual. To counteract this, we check if a company has high current liabilities, relative to its total assets.
Acerinox has total liabilities of €1.4b and total assets of €4.7b. Therefore its current liabilities are equivalent to approximately 29% of its total assets. This is a modest level of current liabilities, which would only have a small effect on ROCE.
Our Take On Acerinox's ROCE
If Acerinox continues to earn an uninspiring ROCE, there may be better places to invest. You might be able to find a better investment than Acerinox. If you want a selection of possible winners, check out this free list of interesting companies that trade on a P/E below 20 (but have proven they can grow earnings).
If you are like me, then you will not want to miss this free list of growing companies that insiders are buying.
We aim to bring you long-term focused research analysis driven by fundamental data. Note that our analysis may not factor in the latest price-sensitive company announcements or qualitative material.
If you spot an error that warrants correction, please contact the editor at editorial-team@simplywallst.com. This article by Simply Wall St is general in nature. It does not constitute a recommendation to buy or sell any stock, and does not take account of your objectives, or your financial situation. Simply Wall St has no position in the stocks mentioned. Thank you for reading.
