Why We Like Centerra Gold Inc.’s (TSE:CG) 6.1% Return On Capital Employed

Today we are going to look at Centerra Gold Inc. (TSE:CG) to see whether it might be an attractive investment prospect. Specifically, we're going to calculate its Return On Capital Employed (ROCE), in the hopes of getting some insight into the business.
Firstly, we'll go over how we calculate ROCE. Next, we'll compare it to others in its industry. Last but not least, we'll look at what impact its current liabilities have on its ROCE.
What is Return On Capital Employed (ROCE)?
ROCE is a measure of a company's yearly pre-tax profit (its return), relative to the capital employed in the business. Generally speaking a higher ROCE is better. Overall, it is a valuable metric that has its flaws. Author Edwin Whiting says to be careful when comparing the ROCE of different businesses, since 'No two businesses are exactly alike.
So, How Do We Calculate ROCE?
Analysts use this formula to calculate return on capital employed:
Return on Capital Employed = Earnings Before Interest and Tax (EBIT) ÷ (Total Assets - Current Liabilities)
Or for Centerra Gold:
0.061 = US$158m ÷ (US$2.9b - US$300m) (Based on the trailing twelve months to June 2019.)
Therefore, Centerra Gold has an ROCE of 6.1%.
View our latest analysis for Centerra Gold
Is Centerra Gold's ROCE Good?
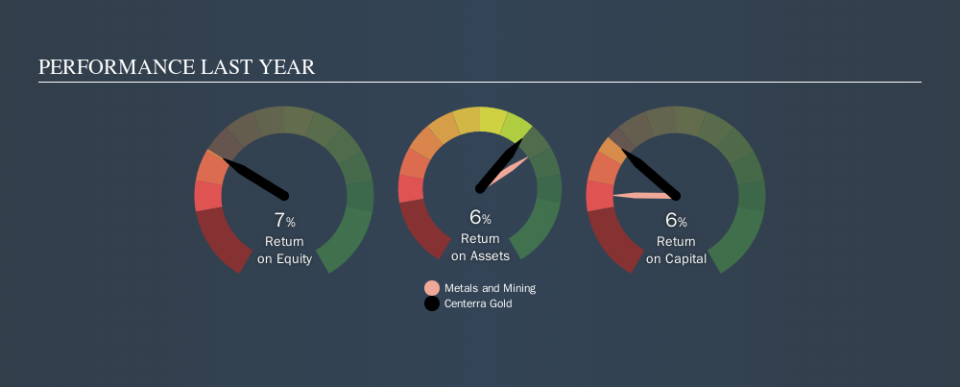
ROCE can be useful when making comparisons, such as between similar companies. Using our data, we find that Centerra Gold's ROCE is meaningfully better than the 3.4% average in the Metals and Mining industry. We consider this a positive sign, because it suggests it uses capital more efficiently than similar companies. Setting aside the industry comparison for now, Centerra Gold's ROCE is mediocre in absolute terms, considering the risk of investing in stocks versus the safety of a bank account. Readers may find more attractive investment prospects elsewhere.
We can see that, Centerra Gold currently has an ROCE of 6.1% compared to its ROCE 3 years ago, which was 1.3%. This makes us think about whether the company has been reinvesting shrewdly. The image below shows how Centerra Gold's ROCE compares to its industry, and you can click it to see more detail on its past growth.
When considering this metric, keep in mind that it is backwards looking, and not necessarily predictive. ROCE can be deceptive for cyclical businesses, as returns can look incredible in boom times, and terribly low in downturns. ROCE is, after all, simply a snap shot of a single year. We note Centerra Gold could be considered a cyclical business. What happens in the future is pretty important for investors, so we have prepared a free report on analyst forecasts for Centerra Gold.
What Are Current Liabilities, And How Do They Affect Centerra Gold's ROCE?
Liabilities, such as supplier bills and bank overdrafts, are referred to as current liabilities if they need to be paid within 12 months. Due to the way the ROCE equation works, having large bills due in the near term can make it look as though a company has less capital employed, and thus a higher ROCE than usual. To check the impact of this, we calculate if a company has high current liabilities relative to its total assets.
Centerra Gold has total assets of US$2.9b and current liabilities of US$300m. As a result, its current liabilities are equal to approximately 10% of its total assets. It is good to see a restrained amount of current liabilities, as this limits the effect on ROCE.
The Bottom Line On Centerra Gold's ROCE
If Centerra Gold continues to earn an uninspiring ROCE, there may be better places to invest. You might be able to find a better investment than Centerra Gold. If you want a selection of possible winners, check out this free list of interesting companies that trade on a P/E below 20 (but have proven they can grow earnings).
If you like to buy stocks alongside management, then you might just love this free list of companies. (Hint: insiders have been buying them).
We aim to bring you long-term focused research analysis driven by fundamental data. Note that our analysis may not factor in the latest price-sensitive company announcements or qualitative material.
If you spot an error that warrants correction, please contact the editor at editorial-team@simplywallst.com. This article by Simply Wall St is general in nature. It does not constitute a recommendation to buy or sell any stock, and does not take account of your objectives, or your financial situation. Simply Wall St has no position in the stocks mentioned. Thank you for reading.
