Why You Should Like Chr. Hansen Holding A/S’s (CPH:CHR) ROCE

Want to participate in a research study? Help shape the future of investing tools and earn a $60 gift card!
Today we are going to look at Chr. Hansen Holding A/S (CPH:CHR) to see whether it might be an attractive investment prospect. Specifically, we're going to calculate its Return On Capital Employed (ROCE), in the hopes of getting some insight into the business.
First up, we'll look at what ROCE is and how we calculate it. Then we'll compare its ROCE to similar companies. Last but not least, we'll look at what impact its current liabilities have on its ROCE.
Understanding Return On Capital Employed (ROCE)
ROCE measures the 'return' (pre-tax profit) a company generates from capital employed in its business. Generally speaking a higher ROCE is better. Ultimately, it is a useful but imperfect metric. Renowned investment researcher Michael Mauboussin has suggested that a high ROCE can indicate that 'one dollar invested in the company generates value of more than one dollar'.
How Do You Calculate Return On Capital Employed?
The formula for calculating the return on capital employed is:
Return on Capital Employed = Earnings Before Interest and Tax (EBIT) ÷ (Total Assets - Current Liabilities)
Or for Chr. Hansen Holding:
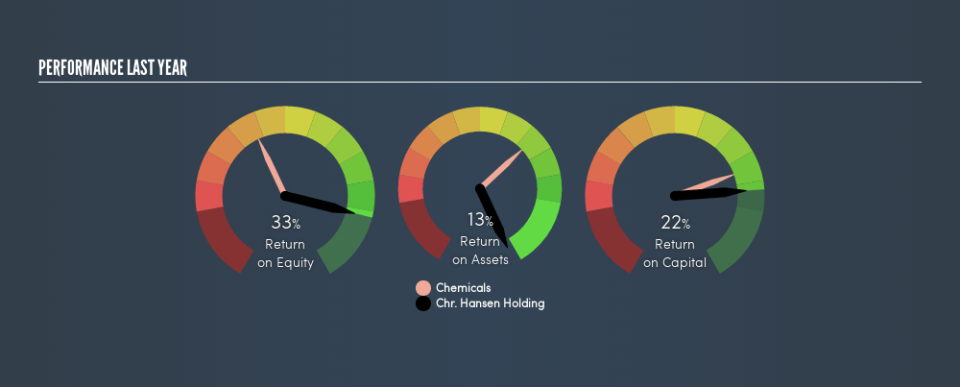
0.22 = €326m ÷ (€1.9b - €416m) (Based on the trailing twelve months to November 2018.)
Therefore, Chr. Hansen Holding has an ROCE of 22%.
View our latest analysis for Chr. Hansen Holding
Does Chr. Hansen Holding Have A Good ROCE?
When making comparisons between similar businesses, investors may find ROCE useful. In our analysis, Chr. Hansen Holding's ROCE is meaningfully higher than the 10% average in the Chemicals industry. We consider this a positive sign, because it suggests it uses capital more efficiently than similar companies. Setting aside the comparison to its industry for a moment, Chr. Hansen Holding's ROCE in absolute terms currently looks quite high.
When considering ROCE, bear in mind that it reflects the past and does not necessarily predict the future. Companies in cyclical industries can be difficult to understand using ROCE, as returns typically look high during boom times, and low during busts. ROCE is, after all, simply a snap shot of a single year. Future performance is what matters, and you can see analyst predictions in our free report on analyst forecasts for the company.
Chr. Hansen Holding's Current Liabilities And Their Impact On Its ROCE
Current liabilities are short term bills and invoices that need to be paid in 12 months or less. Due to the way ROCE is calculated, a high level of current liabilities makes a company look as though it has less capital employed, and thus can (sometimes unfairly) boost the ROCE. To counter this, investors can check if a company has high current liabilities relative to total assets.
Chr. Hansen Holding has total assets of €1.9b and current liabilities of €416m. Therefore its current liabilities are equivalent to approximately 22% of its total assets. This is quite a low level of current liabilities which would not greatly boost the already high ROCE.
What We Can Learn From Chr. Hansen Holding's ROCE
Low current liabilities and high ROCE is a good combination, making Chr. Hansen Holding look quite interesting. Of course, you might find a fantastic investment by looking at a few good candidates. So take a peek at this free list of companies with modest (or no) debt, trading on a P/E below 20.
I will like Chr. Hansen Holding better if I see some big insider buys. While we wait, check out this free list of growing companies with considerable, recent, insider buying.
We aim to bring you long-term focused research analysis driven by fundamental data. Note that our analysis may not factor in the latest price-sensitive company announcements or qualitative material.
If you spot an error that warrants correction, please contact the editor at editorial-team@simplywallst.com. This article by Simply Wall St is general in nature. It does not constitute a recommendation to buy or sell any stock, and does not take account of your objectives, or your financial situation. Simply Wall St has no position in the stocks mentioned. Thank you for reading.
