Why Clearfield, Inc.'s (NASDAQ:CLFD) High P/E Ratio Isn't Necessarily A Bad Thing

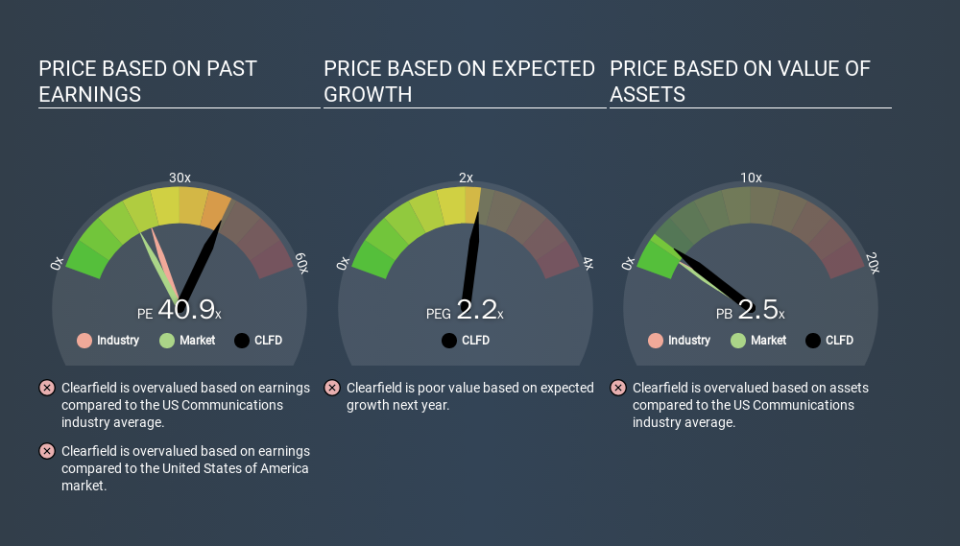
This article is written for those who want to get better at using price to earnings ratios (P/E ratios). We'll apply a basic P/E ratio analysis to Clearfield, Inc.'s (NASDAQ:CLFD), to help you decide if the stock is worth further research. Clearfield has a price to earnings ratio of 40.89, based on the last twelve months. That is equivalent to an earnings yield of about 2.4%.
Check out our latest analysis for Clearfield
How Do I Calculate A Price To Earnings Ratio?
The formula for price to earnings is:
Price to Earnings Ratio = Share Price ÷ Earnings per Share (EPS)
Or for Clearfield:
P/E of 40.89 = $13.89 ÷ $0.34 (Based on the trailing twelve months to September 2019.)
Is A High Price-to-Earnings Ratio Good?
A higher P/E ratio means that investors are paying a higher price for each $1 of company earnings. All else being equal, it's better to pay a low price -- but as Warren Buffett said, 'It's far better to buy a wonderful company at a fair price than a fair company at a wonderful price.
How Does Clearfield's P/E Ratio Compare To Its Peers?
The P/E ratio indicates whether the market has higher or lower expectations of a company. As you can see below, Clearfield has a higher P/E than the average company (21.6) in the communications industry.
That means that the market expects Clearfield will outperform other companies in its industry. The market is optimistic about the future, but that doesn't guarantee future growth. So investors should delve deeper. I like to check if company insiders have been buying or selling.
How Growth Rates Impact P/E Ratios
When earnings fall, the 'E' decreases, over time. That means unless the share price falls, the P/E will increase in a few years. So while a stock may look cheap based on past earnings, it could be expensive based on future earnings.
Clearfield's earnings per share grew by -6.7% in the last twelve months. Unfortunately, earnings per share are down 4.2% a year, over 5 years.
Remember: P/E Ratios Don't Consider The Balance Sheet
Don't forget that the P/E ratio considers market capitalization. In other words, it does not consider any debt or cash that the company may have on the balance sheet. Hypothetically, a company could reduce its future P/E ratio by spending its cash (or taking on debt) to achieve higher earnings.
Such spending might be good or bad, overall, but the key point here is that you need to look at debt to understand the P/E ratio in context.
So What Does Clearfield's Balance Sheet Tell Us?
With net cash of US$24m, Clearfield has a very strong balance sheet, which may be important for its business. Having said that, at 12% of its market capitalization the cash hoard would contribute towards a higher P/E ratio.
The Verdict On Clearfield's P/E Ratio
Clearfield trades on a P/E ratio of 40.9, which is above its market average of 18.1. EPS was up modestly better over the last twelve months. And the net cash position provides the company with multiple options. The high P/E suggests the market thinks further growth will come.
Investors should be looking to buy stocks that the market is wrong about. People often underestimate remarkable growth -- so investors can make money when fast growth is not fully appreciated. So this free visualization of the analyst consensus on future earnings could help you make the right decision about whether to buy, sell, or hold.
Of course, you might find a fantastic investment by looking at a few good candidates. So take a peek at this free list of companies with modest (or no) debt, trading on a P/E below 20.
If you spot an error that warrants correction, please contact the editor at editorial-team@simplywallst.com. This article by Simply Wall St is general in nature. It does not constitute a recommendation to buy or sell any stock, and does not take account of your objectives, or your financial situation. Simply Wall St has no position in the stocks mentioned.
We aim to bring you long-term focused research analysis driven by fundamental data. Note that our analysis may not factor in the latest price-sensitive company announcements or qualitative material. Thank you for reading.
