Why is Comerica (CMA) Up 3.1% Since Its Last Earnings Report?

A month has gone by since the last earnings report for Comerica Incorporated CMA. Shares have added about 3.1% in that time frame.
Will the recent positive trend continue leading up to its next earnings release, or is CMA due for a pullback? Before we dive into how investors and analysts have reacted as of late, let's take a quick look at the most recent earnings report in order to get a better handle on the important catalysts.
Comerica Q2 Earnings Improve Y/Y, Revenues Increase
Comerica reported adjusted earnings per share of $1.90 in second-quarter 2018, up from the year-ago adjusted figure of $1.15. Including certain non-recurring items, earnings came in at $1.87. The Zacks Consensus Estimate was $1.62.
Higher revenues, lower expenses and improved credit metrics were recorded. Moreover, rise in loans was another tailwind. However, lower deposits remained an undermining factor.
Adjusted net income came in at $332 million, up 60.4% year over year. This figure excludes a restructuring charge of $9 million and other non-recurring items.
Segment wise, on a year-over-year basis, net income increased 30% at Business Bank, 100% at Retail Bank and 4.3% at Wealth Management. Finance segment recorded net income against net loss in the prior-year quarter.
Revenues Escalate, Expenses Fall
Comerica’s second-quarter total revenues were $838 million, up 8% year over year. Also, the figure surpassed the Zacks Consensus Estimate of $831.9 million.
Net interest income increased 18% on a year-over-year basis to $590 million. Moreover, net interest margin expanded 59 basis points (bps) to 3.62%.
Total non-interest income came in at $248 million, down 10.1% on a year-over-year basis. Lower card fees, service charge on deposits and other non-interest income were partially offset by increased fiduciary and foreign exchange income.
Further, non-interest expenses totaled $448 million, down 2% year over year. The fall was chiefly due to lower outside processing fee expenses and other non-interest charges.
Solid Balance Sheet
As of Jun 30, 2018, total assets and common shareholders' equity were $72 billion and $8.1 billion, respectively, compared with $71.4 billion and $8 billion as of Jun 30, 2017.
Total loans inched up nearly 1% year over year to $49.8 billion. However, total deposits decreased about 1% from the prior-year quarter to $57.2 billion.
Credit Quality Improved
Total non-performing assets plunged 48% year over year to $264 million. Also, allowance for loan losses was $711 million, down 5.6% from the prior-year period. Additionally, the allowance for loan losses to total loans ratio was 1.36% as of Jun 30, 2018, down from 1.43% as of Jun 30, 2017.
Furthermore, Comerica reported net loan recoveries of $3 million against $18 million net charge-offs recorded in year-ago quarter. In addition, a benefit to provision for credit losses of $29 million was reported.
Strong Capital Position
As of Jun 30, 2018, the company's tangible common equity ratio was 10.42%, up 5 bps year over year. Common equity tier 1 capital ratio was 11.90%, up from 11.51% reported in the year-ago quarter. Total risk-based capital ratio was 13.96%, up from 13.66% in the prior-year quarter.
Capital Deployment Update
Comerica’s capital-deployment initiatives highlight the company’s capital strength. During the reported quarter, Comerica repurchased 1.8 million shares under its existing equity repurchase program. This, combined with dividends, resulted in a total payout of $227 million to shareholders.
Impressive Outlook for 2H18
Comerica guided for second half of 2018, taking into consideration the current economic and rate environment, along with the GEAR Up initiative.
The company anticipates higher net interest income, including the benefit of short-term rate increase, three additional days and loan growth. Notably, full-year benefits from first two quarters of 2018 rate increases of $105-$110 million are expected.
Non-interest income is estimated to be higher resulting from the GEAR Up opportunities, driving growth in treasury management and card fees, along with fiduciary income.
Non-interest expenses are predicted to flare up modestly, excluding restructuring expenses, primarily due to additional three days. Notably, GEAR Up savings is expected to remain on track.
Restructuring charges of $20-$25 million are anticipated. Persistent higher technology expenditures and typical inflationary pressures are likely to occur, leading to elevated occupancy and advertising expenses.
Provision for credit losses are likely to be $10-$20 million per quarter and net charge-offs will likely be low.
Income tax expenses are anticipated to approximate 23% of pre-tax income, excluding further tax impact from employee stock transactions.
Comerica expects average loan growth to be modest. The outlook reflects rise across most lines of business with a slower pace in general Middle Market, National Dealer Services and Mortgage Banker Finance due to seasonality, and stability in energy and corporate banking portfolios.
How Have Estimates Been Moving Since Then?
In the past month, investors have witnessed an upward trend in fresh estimates. There have been six revisions higher for the current quarter compared to one lower.
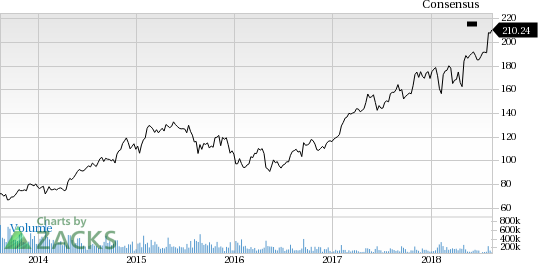
Comerica Incorporated Price and Consensus
Comerica Incorporated Price and Consensus | Comerica Incorporated Quote
VGM Scores
At this time, CMA has a poor Growth Score of F, a grade with the same score on the momentum front. However, the stock was allocated a grade of C on the value side, putting it in the middle 20% for this investment strategy.
Overall, the stock has an aggregate VGM score of F. If you aren't focused on one strategy, this score is the one you should be interested in.
The company's stock is suitable solely for value based on our styles scores.
Outlook
Estimates have been broadly trending upward for the stock and the magnitude of these revisions looks promising. It comes with little surprise CMA has a Zacks Rank #1 (Strong Buy). We expect an above average return from the stock in the next few months.
Want the latest recommendations from Zacks Investment Research? Today, you can download 7 Best Stocks for the Next 30 Days. Click to get this free report
Comerica Incorporated (CMA) : Free Stock Analysis Report
To read this article on Zacks.com click here.
Zacks Investment Research
