Why Contact Energy Limited (NZSE:CEN) May Not Be As Efficient As Its Industry

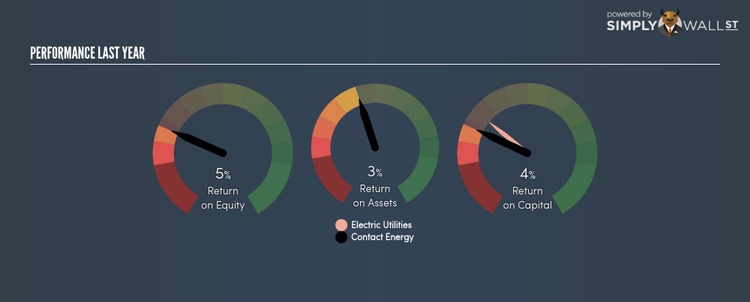
Contact Energy Limited’s (NZSE:CEN) most recent return on equity was a substandard 5.36% relative to its industry performance of 5.56% over the past year. Though CEN’s recent performance is underwhelming, it is useful to understand what ROE is made up of and how it should be interpreted. Knowing these components can change your views on CEN’s below-average returns. Metrics such as financial leverage can impact the level of ROE which in turn can affect the sustainability of CEN’s returns. Let me show you what I mean by this. See our latest analysis for CEN
Peeling the layers of ROE – trisecting a company’s profitability
Return on Equity (ROE) weighs CEN’s profit against the level of its shareholders’ equity. For example, if CEN invests NZ$1 in the form of equity, it will generate NZ$0.05 in earnings from this. Generally speaking, a higher ROE is preferred; however, there are other factors we must also consider before making any conclusions.
Return on Equity = Net Profit ÷ Shareholders Equity
ROE is measured against cost of equity in order to determine the efficiency of CEN’s equity capital deployed. Its cost of equity is 8.55%. Since CEN’s return does not cover its cost, with a difference of -3.19%, this means its current use of equity is not efficient and not sustainable. Very simply, CEN pays more for its capital than what it generates in return. ROE can be broken down into three different ratios: net profit margin, asset turnover, and financial leverage. This is called the Dupont Formula:
Dupont Formula
ROE = profit margin × asset turnover × financial leverage
ROE = (annual net profit ÷ sales) × (sales ÷ assets) × (assets ÷ shareholders’ equity)
ROE = annual net profit ÷ shareholders’ equity
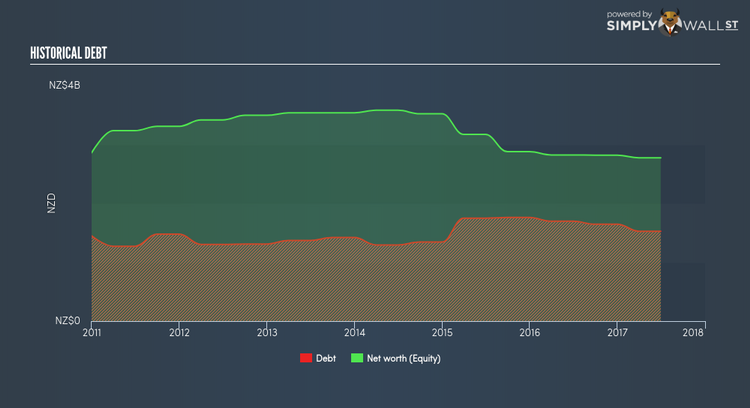
The first component is profit margin, which measures how much of sales is retained after the company pays for all its expenses. The other component, asset turnover, illustrates how much revenue CEN can make from its asset base. Finally, financial leverage will be our main focus today. It shows how much of assets are funded by equity and can show how sustainable CEN’s capital structure is. Since financial leverage can artificially inflate ROE, we need to look at how much debt CEN currently has. Currently the debt-to-equity ratio stands at a reasonable 55.03%, which means its ROE is driven by its ability to grow its profit without a significant debt burden.
What this means for you:
Are you a shareholder? CEN’s ROE is underwhelming relative to the industry average, and its returns were also not strong enough to cover its own cost of equity. However, investors shouldn’t despair since ROE is not inflated by excessive debt, which means CEN still has room to improve shareholder returns by raising debt to fund new investments. If you’re looking for new ideas for high-returning stocks, you should take a look at our free platform to see the list of stocks with Return on Equity over 20%.
Are you a potential investor? If you are considering investing in CEN, looking at ROE on its own is not enough to make a well-informed decision. I recommend you do additional fundamental analysis by looking through our most recent infographic report on Contact Energy to help you make a more informed investment decision.
To help readers see pass the short term volatility of the financial market, we aim to bring you a long-term focused research analysis purely driven by fundamental data. Note that our analysis does not factor in the latest price sensitive company announcements.
The author is an independent contributor and at the time of publication had no position in the stocks mentioned.
