Why Delek US Holdings, Inc.’s (NYSE:DK) Return On Capital Employed Is Impressive

Today we'll look at Delek US Holdings, Inc. (NYSE:DK) and reflect on its potential as an investment. To be precise, we'll consider its Return On Capital Employed (ROCE), as that will inform our view of the quality of the business.
Firstly, we'll go over how we calculate ROCE. Then we'll compare its ROCE to similar companies. And finally, we'll look at how its current liabilities are impacting its ROCE.
What is Return On Capital Employed (ROCE)?
ROCE is a measure of a company's yearly pre-tax profit (its return), relative to the capital employed in the business. In general, businesses with a higher ROCE are usually better quality. In brief, it is a useful tool, but it is not without drawbacks. Author Edwin Whiting says to be careful when comparing the ROCE of different businesses, since 'No two businesses are exactly alike.
So, How Do We Calculate ROCE?
Analysts use this formula to calculate return on capital employed:
Return on Capital Employed = Earnings Before Interest and Tax (EBIT) ÷ (Total Assets - Current Liabilities)
Or for Delek US Holdings:
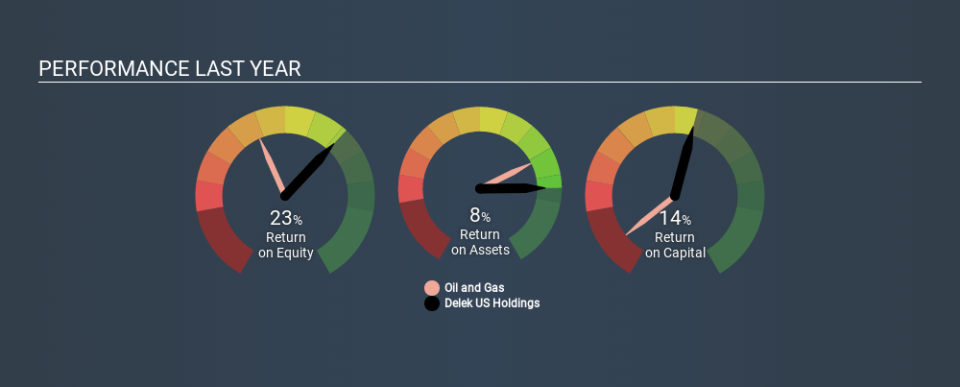
0.14 = US$629m ÷ (US$6.8b - US$2.2b) (Based on the trailing twelve months to September 2019.)
So, Delek US Holdings has an ROCE of 14%.
View our latest analysis for Delek US Holdings
Is Delek US Holdings's ROCE Good?
ROCE can be useful when making comparisons, such as between similar companies. Delek US Holdings's ROCE appears to be substantially greater than the 9.0% average in the Oil and Gas industry. We would consider this a positive, as it suggests it is using capital more effectively than other similar companies. Regardless of where Delek US Holdings sits next to its industry, its ROCE in absolute terms appears satisfactory, and this company could be worth a closer look.
Delek US Holdings delivered an ROCE of 14%, which is better than 3 years ago, as was making losses back then. That implies the business has been improving. You can see in the image below how Delek US Holdings's ROCE compares to its industry. Click to see more on past growth.
When considering this metric, keep in mind that it is backwards looking, and not necessarily predictive. ROCE can be deceptive for cyclical businesses, as returns can look incredible in boom times, and terribly low in downturns. This is because ROCE only looks at one year, instead of considering returns across a whole cycle. Given the industry it operates in, Delek US Holdings could be considered cyclical. Future performance is what matters, and you can see analyst predictions in our free report on analyst forecasts for the company.
Delek US Holdings's Current Liabilities And Their Impact On Its ROCE
Short term (or current) liabilities, are things like supplier invoices, overdrafts, or tax bills that need to be paid within 12 months. The ROCE equation subtracts current liabilities from capital employed, so a company with a lot of current liabilities appears to have less capital employed, and a higher ROCE than otherwise. To check the impact of this, we calculate if a company has high current liabilities relative to its total assets.
Delek US Holdings has total assets of US$6.8b and current liabilities of US$2.2b. As a result, its current liabilities are equal to approximately 33% of its total assets. Delek US Holdings has a middling amount of current liabilities, increasing its ROCE somewhat.
What We Can Learn From Delek US Holdings's ROCE
With a decent ROCE, the company could be interesting, but remember that the level of current liabilities make the ROCE look better. There might be better investments than Delek US Holdings out there, but you will have to work hard to find them . These promising businesses with rapidly growing earnings might be right up your alley.
For those who like to find winning investments this free list of growing companies with recent insider purchasing, could be just the ticket.
If you spot an error that warrants correction, please contact the editor at editorial-team@simplywallst.com. This article by Simply Wall St is general in nature. It does not constitute a recommendation to buy or sell any stock, and does not take account of your objectives, or your financial situation. Simply Wall St has no position in the stocks mentioned.
We aim to bring you long-term focused research analysis driven by fundamental data. Note that our analysis may not factor in the latest price-sensitive company announcements or qualitative material. Thank you for reading.
