Why DXP Enterprises, Inc.'s (NASDAQ:DXPE) High P/E Ratio Isn't Necessarily A Bad Thing

Want to participate in a short research study? Help shape the future of investing tools and you could win a $250 gift card!
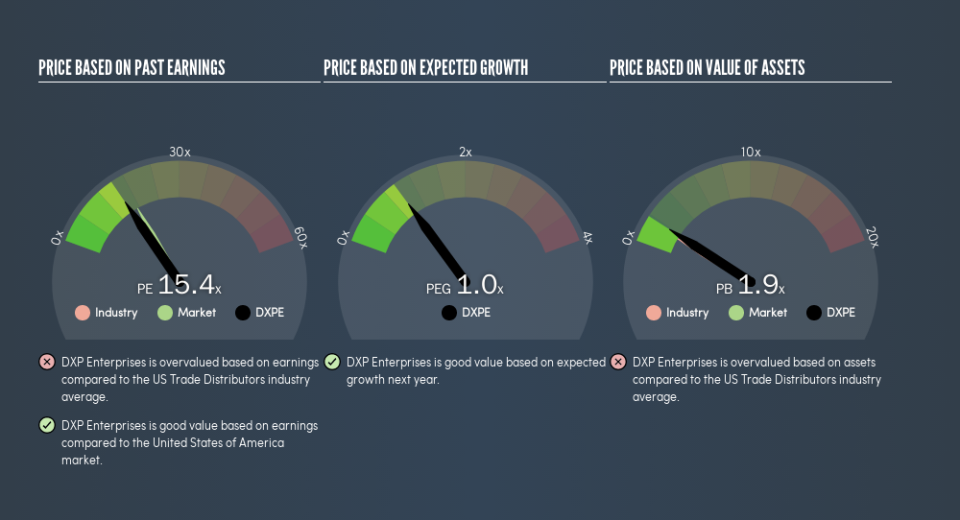
This article is for investors who would like to improve their understanding of price to earnings ratios (P/E ratios). To keep it practical, we'll show how DXP Enterprises, Inc.'s (NASDAQ:DXPE) P/E ratio could help you assess the value on offer. What is DXP Enterprises's P/E ratio? Well, based on the last twelve months it is 15.36. That corresponds to an earnings yield of approximately 6.5%.
See our latest analysis for DXP Enterprises
How Do I Calculate A Price To Earnings Ratio?
The formula for P/E is:
Price to Earnings Ratio = Price per Share ÷ Earnings per Share (EPS)
Or for DXP Enterprises:
P/E of 15.36 = $33.67 ÷ $2.19 (Based on the year to March 2019.)
Is A High Price-to-Earnings Ratio Good?
A higher P/E ratio implies that investors pay a higher price for the earning power of the business. All else being equal, it's better to pay a low price -- but as Warren Buffett said, 'It's far better to buy a wonderful company at a fair price than a fair company at a wonderful price.'
How Growth Rates Impact P/E Ratios
Probably the most important factor in determining what P/E a company trades on is the earnings growth. That's because companies that grow earnings per share quickly will rapidly increase the 'E' in the equation. Therefore, even if you pay a high multiple of earnings now, that multiple will become lower in the future. And as that P/E ratio drops, the company will look cheap, unless its share price increases.
DXP Enterprises's earnings made like a rocket, taking off 111% last year. On the other hand, the longer term performance is poor, with EPS down 11% per year over 5 years.
Does DXP Enterprises Have A Relatively High Or Low P/E For Its Industry?
The P/E ratio indicates whether the market has higher or lower expectations of a company. As you can see below DXP Enterprises has a P/E ratio that is fairly close for the average for the trade distributors industry, which is 15.
DXP Enterprises's P/E tells us that market participants think its prospects are roughly in line with its industry. If the company has better than average prospects, then the market might be underestimating it. Further research into factors such asmanagement tenure, could help you form your own view on whether that is likely.
Don't Forget: The P/E Does Not Account For Debt or Bank Deposits
It's important to note that the P/E ratio considers the market capitalization, not the enterprise value. That means it doesn't take debt or cash into account. In theory, a company can lower its future P/E ratio by using cash or debt to invest in growth.
Such spending might be good or bad, overall, but the key point here is that you need to look at debt to understand the P/E ratio in context.
DXP Enterprises's Balance Sheet
DXP Enterprises has net debt equal to 47% of its market cap. While it's worth keeping this in mind, it isn't a worry.
The Verdict On DXP Enterprises's P/E Ratio
DXP Enterprises's P/E is 15.4 which is below average (17.2) in the US market. The EPS growth last year was strong, and debt levels are quite reasonable. If the company can continue to grow earnings, then the current P/E may be unjustifiably low. Given analysts are expecting further growth, one might have expected a higher P/E ratio. That may be worth further research.
When the market is wrong about a stock, it gives savvy investors an opportunity. If it is underestimating a company, investors can make money by buying and holding the shares until the market corrects itself. So this free visual report on analyst forecasts could hold the key to an excellent investment decision.
Of course you might be able to find a better stock than DXP Enterprises. So you may wish to see this free collection of other companies that have grown earnings strongly.
We aim to bring you long-term focused research analysis driven by fundamental data. Note that our analysis may not factor in the latest price-sensitive company announcements or qualitative material.
If you spot an error that warrants correction, please contact the editor at editorial-team@simplywallst.com. This article by Simply Wall St is general in nature. It does not constitute a recommendation to buy or sell any stock, and does not take account of your objectives, or your financial situation. Simply Wall St has no position in the stocks mentioned. Thank you for reading.
