Here’s why Econocom Group SE’s (EBR:ECONB) Returns On Capital Matters So Much

Today we'll evaluate Econocom Group SE (EBR:ECONB) to determine whether it could have potential as an investment idea. Specifically, we're going to calculate its Return On Capital Employed (ROCE), in the hopes of getting some insight into the business.
Firstly, we'll go over how we calculate ROCE. Next, we'll compare it to others in its industry. Last but not least, we'll look at what impact its current liabilities have on its ROCE.
Return On Capital Employed (ROCE): What is it?
ROCE measures the amount of pre-tax profits a company can generate from the capital employed in its business. In general, businesses with a higher ROCE are usually better quality. Overall, it is a valuable metric that has its flaws. Author Edwin Whiting says to be careful when comparing the ROCE of different businesses, since 'No two businesses are exactly alike.
How Do You Calculate Return On Capital Employed?
Analysts use this formula to calculate return on capital employed:
Return on Capital Employed = Earnings Before Interest and Tax (EBIT) ÷ (Total Assets - Current Liabilities)
Or for Econocom Group:
0.10 = €124m ÷ (€3.0b - €1.8b) (Based on the trailing twelve months to June 2019.)
Therefore, Econocom Group has an ROCE of 10%.
Check out our latest analysis for Econocom Group
Does Econocom Group Have A Good ROCE?
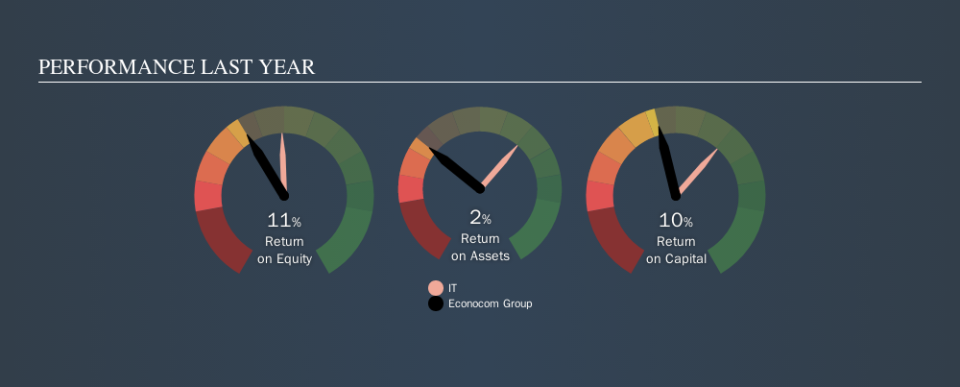
One way to assess ROCE is to compare similar companies. In this analysis, Econocom Group's ROCE appears meaningfully below the 13% average reported by the IT industry. This could be seen as a negative, as it suggests some competitors may be employing their capital more efficiently. Separate from Econocom Group's performance relative to its industry, its ROCE in absolute terms looks satisfactory, and it may be worth researching in more depth.
We can see that, Econocom Group currently has an ROCE of 10%, less than the 17% it reported 3 years ago. So investors might consider if it has had issues recently. The image below shows how Econocom Group's ROCE compares to its industry, and you can click it to see more detail on its past growth.
It is important to remember that ROCE shows past performance, and is not necessarily predictive. Companies in cyclical industries can be difficult to understand using ROCE, as returns typically look high during boom times, and low during busts. This is because ROCE only looks at one year, instead of considering returns across a whole cycle. Since the future is so important for investors, you should check out our free report on analyst forecasts for Econocom Group.
What Are Current Liabilities, And How Do They Affect Econocom Group's ROCE?
Current liabilities are short term bills and invoices that need to be paid in 12 months or less. The ROCE equation subtracts current liabilities from capital employed, so a company with a lot of current liabilities appears to have less capital employed, and a higher ROCE than otherwise. To counteract this, we check if a company has high current liabilities, relative to its total assets.
Econocom Group has total liabilities of €1.8b and total assets of €3.0b. Therefore its current liabilities are equivalent to approximately 60% of its total assets. Econocom Group's current liabilities are fairly high, which increases its ROCE significantly.
Our Take On Econocom Group's ROCE
The ROCE would not look as appealing if the company had fewer current liabilities. There might be better investments than Econocom Group out there, but you will have to work hard to find them . These promising businesses with rapidly growing earnings might be right up your alley.
If you are like me, then you will not want to miss this free list of growing companies that insiders are buying.
We aim to bring you long-term focused research analysis driven by fundamental data. Note that our analysis may not factor in the latest price-sensitive company announcements or qualitative material.
If you spot an error that warrants correction, please contact the editor at editorial-team@simplywallst.com. This article by Simply Wall St is general in nature. It does not constitute a recommendation to buy or sell any stock, and does not take account of your objectives, or your financial situation. Simply Wall St has no position in the stocks mentioned. Thank you for reading.
