Why Enghouse Systems Limited's (TSE:ENGH) High P/E Ratio Isn't Necessarily A Bad Thing

This article is for investors who would like to improve their understanding of price to earnings ratios (P/E ratios). We'll apply a basic P/E ratio analysis to Enghouse Systems Limited's (TSE:ENGH), to help you decide if the stock is worth further research. Enghouse Systems has a P/E ratio of 31.48, based on the last twelve months. That corresponds to an earnings yield of approximately 3.2%.
View our latest analysis for Enghouse Systems
How Do You Calculate A P/E Ratio?
The formula for P/E is:
Price to Earnings Ratio = Price per Share ÷ Earnings per Share (EPS)
Or for Enghouse Systems:
P/E of 31.48 = CA$37.89 ÷ CA$1.20 (Based on the year to July 2019.)
Is A High Price-to-Earnings Ratio Good?
The higher the P/E ratio, the higher the price tag of a business, relative to its trailing earnings. That isn't necessarily good or bad, but a high P/E implies relatively high expectations of what a company can achieve in the future.
Does Enghouse Systems Have A Relatively High Or Low P/E For Its Industry?
The P/E ratio indicates whether the market has higher or lower expectations of a company. You can see in the image below that the average P/E (17.9) for companies in the software industry is lower than Enghouse Systems's P/E.
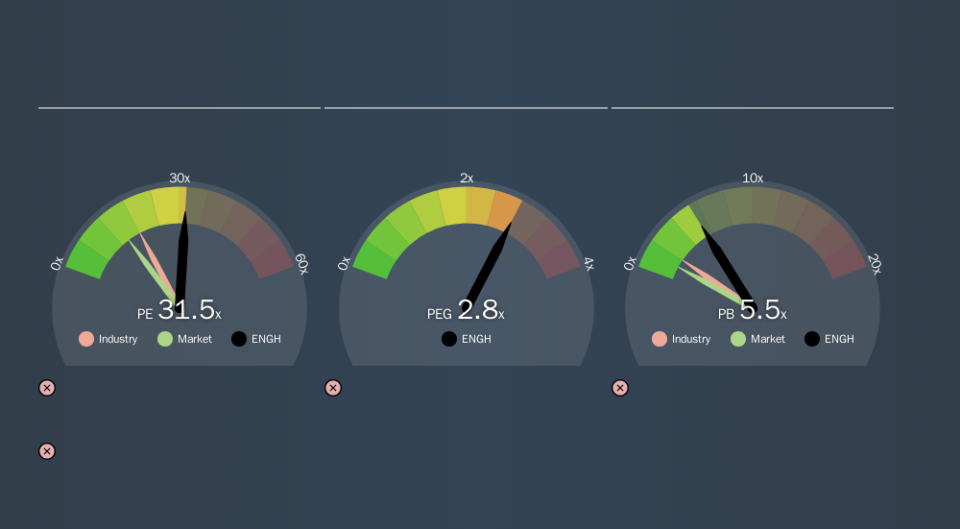
That means that the market expects Enghouse Systems will outperform other companies in its industry. Clearly the market expects growth, but it isn't guaranteed. So investors should delve deeper. I like to check if company insiders have been buying or selling.
How Growth Rates Impact P/E Ratios
P/E ratios primarily reflect market expectations around earnings growth rates. When earnings grow, the 'E' increases, over time. And in that case, the P/E ratio itself will drop rather quickly. Then, a lower P/E should attract more buyers, pushing the share price up.
It's great to see that Enghouse Systems grew EPS by 14% in the last year. And earnings per share have improved by 16% annually, over the last five years. So one might expect an above average P/E ratio.
Remember: P/E Ratios Don't Consider The Balance Sheet
Don't forget that the P/E ratio considers market capitalization. Thus, the metric does not reflect cash or debt held by the company. Theoretically, a business can improve its earnings (and produce a lower P/E in the future) by investing in growth. That means taking on debt (or spending its cash).
Such expenditure might be good or bad, in the long term, but the point here is that the balance sheet is not reflected by this ratio.
So What Does Enghouse Systems's Balance Sheet Tell Us?
The extra options and safety that comes with Enghouse Systems's CA$141m net cash position means that it deserves a higher P/E than it would if it had a lot of net debt.
The Bottom Line On Enghouse Systems's P/E Ratio
Enghouse Systems has a P/E of 31.5. That's higher than the average in its market, which is 14.2. Its strong balance sheet gives the company plenty of resources for extra growth, and it has already proven it can grow. Therefore it seems reasonable that the market would have relatively high expectations of the company
When the market is wrong about a stock, it gives savvy investors an opportunity. As value investor Benjamin Graham famously said, 'In the short run, the market is a voting machine but in the long run, it is a weighing machine. So this free visualization of the analyst consensus on future earnings could help you make the right decision about whether to buy, sell, or hold.
But note: Enghouse Systems may not be the best stock to buy. So take a peek at this free list of interesting companies with strong recent earnings growth (and a P/E ratio below 20).
We aim to bring you long-term focused research analysis driven by fundamental data. Note that our analysis may not factor in the latest price-sensitive company announcements or qualitative material.
If you spot an error that warrants correction, please contact the editor at editorial-team@simplywallst.com. This article by Simply Wall St is general in nature. It does not constitute a recommendation to buy or sell any stock, and does not take account of your objectives, or your financial situation. Simply Wall St has no position in the stocks mentioned. Thank you for reading.
