Here’s why The Ensign Group, Inc.’s (NASDAQ:ENSG) Returns On Capital Matters So Much

Today we are going to look at The Ensign Group, Inc. (NASDAQ:ENSG) to see whether it might be an attractive investment prospect. Specifically, we'll consider its Return On Capital Employed (ROCE), since that will give us an insight into how efficiently the business can generate profits from the capital it requires.
First up, we'll look at what ROCE is and how we calculate it. Second, we'll look at its ROCE compared to similar companies. And finally, we'll look at how its current liabilities are impacting its ROCE.
Understanding Return On Capital Employed (ROCE)
ROCE measures the 'return' (pre-tax profit) a company generates from capital employed in its business. In general, businesses with a higher ROCE are usually better quality. In brief, it is a useful tool, but it is not without drawbacks. Author Edwin Whiting says to be careful when comparing the ROCE of different businesses, since 'No two businesses are exactly alike.'
How Do You Calculate Return On Capital Employed?
Analysts use this formula to calculate return on capital employed:
Return on Capital Employed = Earnings Before Interest and Tax (EBIT) ÷ (Total Assets - Current Liabilities)
Or for Ensign Group:
0.077 = US$154m ÷ (US$2.3b - US$327m) (Based on the trailing twelve months to June 2019.)
So, Ensign Group has an ROCE of 7.7%.
Check out our latest analysis for Ensign Group
Does Ensign Group Have A Good ROCE?
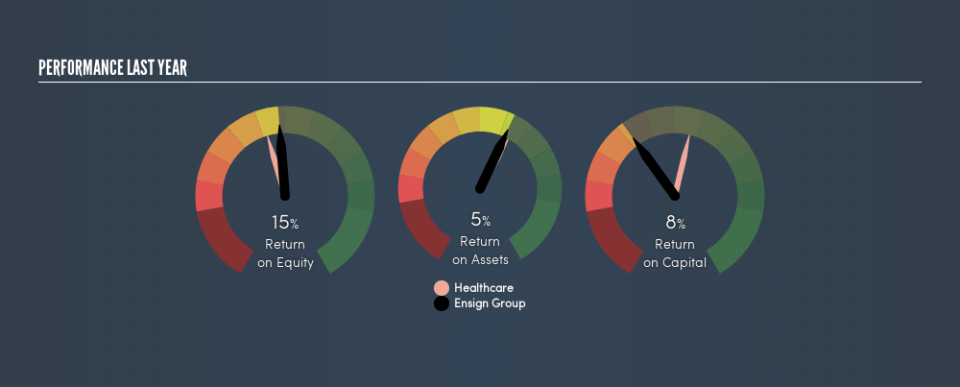
When making comparisons between similar businesses, investors may find ROCE useful. Using our data, Ensign Group's ROCE appears to be significantly below the 11% average in the Healthcare industry. This performance could be negative if sustained, as it suggests the business may underperform its industry. Setting aside the industry comparison for now, Ensign Group's ROCE is mediocre in absolute terms, considering the risk of investing in stocks versus the safety of a bank account. It is possible that there are more rewarding investments out there.
Ensign Group's current ROCE of 7.7% is lower than its ROCE in the past, which was 14%, 3 years ago. Therefore we wonder if the company is facing new headwinds. The image below shows how Ensign Group's ROCE compares to its industry, and you can click it to see more detail on its past growth.
When considering ROCE, bear in mind that it reflects the past and does not necessarily predict the future. ROCE can be misleading for companies in cyclical industries, with returns looking impressive during the boom times, but very weak during the busts. ROCE is only a point-in-time measure. Since the future is so important for investors, you should check out our free report on analyst forecasts for Ensign Group.
What Are Current Liabilities, And How Do They Affect Ensign Group's ROCE?
Current liabilities are short term bills and invoices that need to be paid in 12 months or less. Due to the way the ROCE equation works, having large bills due in the near term can make it look as though a company has less capital employed, and thus a higher ROCE than usual. To counter this, investors can check if a company has high current liabilities relative to total assets.
Ensign Group has total assets of US$2.3b and current liabilities of US$327m. Therefore its current liabilities are equivalent to approximately 14% of its total assets. This is a modest level of current liabilities, which would only have a small effect on ROCE.
The Bottom Line On Ensign Group's ROCE
That said, Ensign Group's ROCE is mediocre, there may be more attractive investments around. But note: make sure you look for a great company, not just the first idea you come across. So take a peek at this free list of interesting companies with strong recent earnings growth (and a P/E ratio below 20).
I will like Ensign Group better if I see some big insider buys. While we wait, check out this free list of growing companies with considerable, recent, insider buying.
We aim to bring you long-term focused research analysis driven by fundamental data. Note that our analysis may not factor in the latest price-sensitive company announcements or qualitative material.
If you spot an error that warrants correction, please contact the editor at editorial-team@simplywallst.com. This article by Simply Wall St is general in nature. It does not constitute a recommendation to buy or sell any stock, and does not take account of your objectives, or your financial situation. Simply Wall St has no position in the stocks mentioned. Thank you for reading.
