Why First Busey Corporation (NASDAQ:BUSE) May Not Be As Efficient As Its Industry

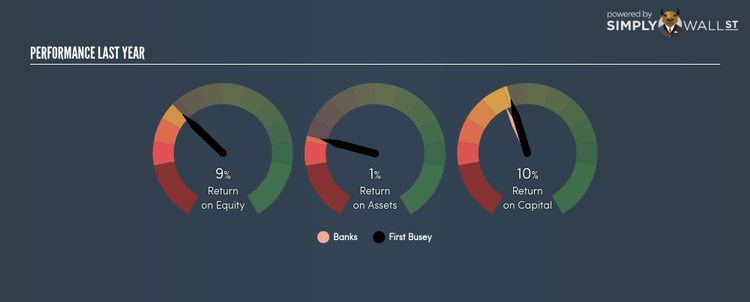
First Busey Corporation (NASDAQ:BUSE) generated a below-average return on equity of 8.64% in the past 12 months, while its industry returned 8.93%. An investor may attribute an inferior ROE to a relatively inefficient performance, and whilst this can often be the case, knowing the nuts and bolts of the ROE calculation may change that perspective and give you a deeper insight into BUSE’s past performance. I will take you through how metrics such as financial leverage impact ROE which may affect the overall sustainability of BUSE’s returns. Check out our latest analysis for First Busey
What you must know about ROE
Firstly, Return on Equity, or ROE, is simply the percentage of last years’ earning against the book value of shareholders’ equity. An ROE of 8.64% implies $0.09 returned on every $1 invested. In most cases, a higher ROE is preferred; however, there are many other factors we must consider prior to making any investment decisions.
Return on Equity = Net Profit ÷ Shareholders Equity
ROE is measured against cost of equity in order to determine the efficiency of First Busey’s equity capital deployed. Its cost of equity is 9.86%. Given a discrepancy of -1.22% between return and cost, this indicated that First Busey may be paying more for its capital than what it’s generating in return. ROE can be dissected into three distinct ratios: net profit margin, asset turnover, and financial leverage. This is called the Dupont Formula:
Dupont Formula
ROE = profit margin × asset turnover × financial leverage
ROE = (annual net profit ÷ sales) × (sales ÷ assets) × (assets ÷ shareholders’ equity)
ROE = annual net profit ÷ shareholders’ equity
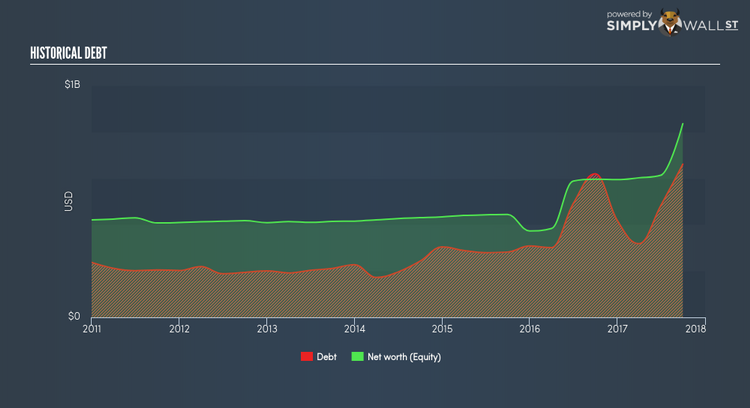
The first component is profit margin, which measures how much of sales is retained after the company pays for all its expenses. Asset turnover reveals how much revenue can be generated from First Busey’s asset base. Finally, financial leverage will be our main focus today. It shows how much of assets are funded by equity and can show how sustainable the company’s capital structure is. Since financial leverage can artificially inflate ROE, we need to look at how much debt First Busey currently has. The debt-to-equity ratio currently stands at a sensible 79.08%, meaning the ROE is a result of its capacity to produce profit growth without a huge debt burden.
What this means for you:
Are you a shareholder? BUSE exhibits a weak ROE against its peers, as well as insufficient levels to cover its own cost of equity this year. However, investors shouldn’t despair since ROE is not inflated by excessive debt, which means BUSE still has room to improve shareholder returns by raising debt to fund new investments. If you’re looking for new ideas for high-returning stocks, you should take a look at our free platform to see the list of stocks with Return on Equity over 20%.
Are you a potential investor? If BUSE has been on your watch list for a while, making an investment decision based on ROE alone is unwise. I recommend you do additional fundamental analysis by looking through our most recent infographic report on First Busey to help you make a more informed investment decision.
To help readers see pass the short term volatility of the financial market, we aim to bring you a long-term focused research analysis purely driven by fundamental data. Note that our analysis does not factor in the latest price sensitive company announcements.
The author is an independent contributor and at the time of publication had no position in the stocks mentioned.
