Why HCP Inc’s (HCP) ROE Of 7.79% Does Not Tell The Whole Story

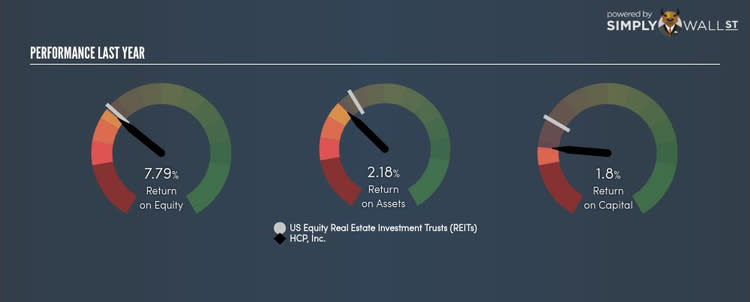
HCP Inc’s (NYSE:HCP) most recent return on equity was a substandard 7.79% relative to its industry performance of 8.29% over the past year. HCP's results could indicate a relatively inefficient operation to its peers, and while this may be the case, it is important to understand what ROE is made up of and how it should be interpreted. Knowing these components could change your view on HCP’s performance. Metrics such as financial leverage can impact the level of ROE which in turn can affect the sustainability of HCP's returns. Let me show you what I mean by this. Check out our latest analysis for HCP
What you must know about ROE
Firstly, Return on Equity, or ROE, is simply the percentage of last years’ earning against the book value of shareholders’ equity. An ROE of 7.79% implies $0.08 returned on every $1 invested. While a higher ROE is preferred in most cases, there are several other factors we should consider before drawing any conclusions.
Return on Equity = Net Profit ÷ Shareholders Equity
Returns are usually compared to costs to measure the efficiency of capital. HCP’s cost of equity is 8.49%. This means HCP’s returns actually do not cover its own cost of equity, with a discrepancy of -0.71%. This isn’t sustainable as it implies, very simply, that the company pays more for its capital than what it generates in return. ROE can be split up into three useful ratios: net profit margin, asset turnover, and financial leverage. This is called the Dupont Formula:
Dupont Formula
ROE = profit margin × asset turnover × financial leverage
ROE = (annual net profit ÷ sales) × (sales ÷ assets) × (assets ÷ shareholders’ equity)
ROE = annual net profit ÷ shareholders’ equity
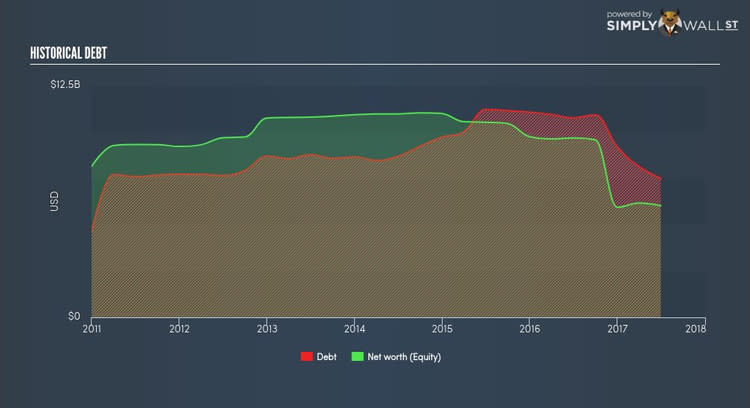
Essentially, profit margin shows how much money the company makes after paying for all its expenses. The other component, asset turnover, illustrates how much revenue HCP can make from its asset base. And finally, financial leverage is simply how much of assets are funded by equity, which exhibits how sustainable HCP’s capital structure is. Since ROE can be artificially increased through excessive borrowing, we should check HCP’s historic debt-to-equity ratio. The debt-to-equity ratio currently stands at a balanced 124.30%, meaning the ROE is a result of its capacity to produce profit growth without a huge debt burden.
What this means for you:
Are you a shareholder? HCP’s below-industry ROE is disappointing, furthermore, its returns were not even high enough to cover its own cost of equity. Since its existing ROE is not fuelled by unsustainable debt, investors shouldn’t give up as HCP still has capacity to improve shareholder returns by borrowing to invest in new projects in the future.
Are you a potential investor? If you are considering investing in HCP, basing your decision on ROE alone is certainly not sufficient. I recommend you do additional fundamental analysis by looking through our most recent infographic report on HCP to help you make a more informed investment decision. If you are not interested in HCP anymore, you can use our free platform to see our list of stocks with Return on Equity over 20%.
To help readers see pass the short term volatility of the financial market, we aim to bring you a long-term focused research analysis purely driven by fundamental data. Note that our analysis does not factor in the latest price sensitive company announcements.
The author is an independent contributor and at the time of publication had no position in the stocks mentioned.
