Why Heidelberger Druckmaschinen Aktiengesellschaft's (ETR:HDD) High P/E Ratio Isn't Necessarily A Bad Thing

Today, we'll introduce the concept of the P/E ratio for those who are learning about investing. We'll apply a basic P/E ratio analysis to Heidelberger Druckmaschinen Aktiengesellschaft's (ETR:HDD), to help you decide if the stock is worth further research. Based on the last twelve months, Heidelberger Druckmaschinen's P/E ratio is 30.69. In other words, at today's prices, investors are paying €30.69 for every €1 in prior year profit.
View our latest analysis for Heidelberger Druckmaschinen
How Do You Calculate A P/E Ratio?
The formula for price to earnings is:
Price to Earnings Ratio = Share Price ÷ Earnings per Share (EPS)
Or for Heidelberger Druckmaschinen:
P/E of 30.69 = €1.14 ÷ €0.04 (Based on the year to September 2019.)
Is A High P/E Ratio Good?
A higher P/E ratio means that investors are paying a higher price for each €1 of company earnings. That isn't necessarily good or bad, but a high P/E implies relatively high expectations of what a company can achieve in the future.
How Does Heidelberger Druckmaschinen's P/E Ratio Compare To Its Peers?
One good way to get a quick read on what market participants expect of a company is to look at its P/E ratio. The image below shows that Heidelberger Druckmaschinen has a higher P/E than the average (16.7) P/E for companies in the machinery industry.
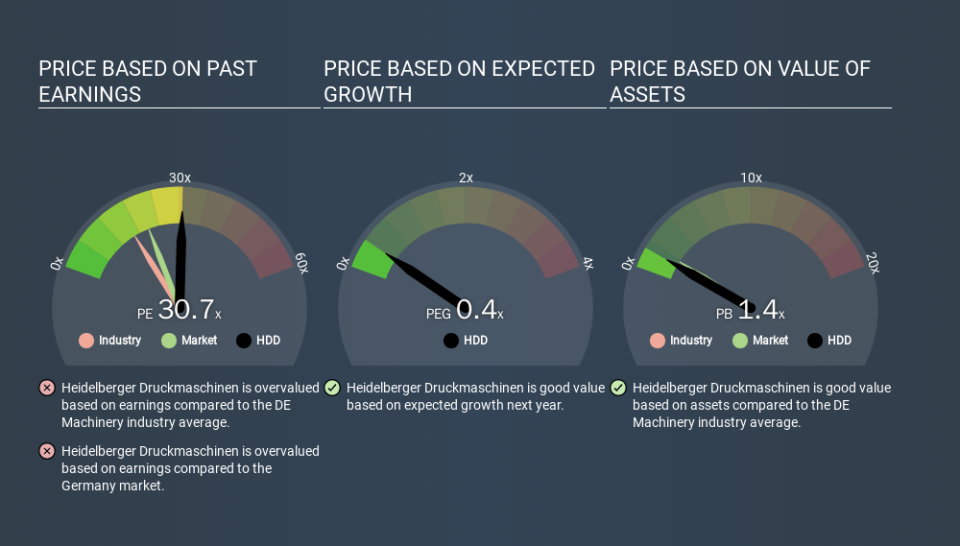
Its relatively high P/E ratio indicates that Heidelberger Druckmaschinen shareholders think it will perform better than other companies in its industry classification. Clearly the market expects growth, but it isn't guaranteed. So further research is always essential. I often monitor director buying and selling.
How Growth Rates Impact P/E Ratios
Companies that shrink earnings per share quickly will rapidly decrease the 'E' in the equation. That means unless the share price falls, the P/E will increase in a few years. So while a stock may look cheap based on past earnings, it could be expensive based on future earnings.
It's nice to see that Heidelberger Druckmaschinen grew EPS by a stonking 49% in the last year. But earnings per share are down 12% per year over the last three years.
A Limitation: P/E Ratios Ignore Debt and Cash In The Bank
One drawback of using a P/E ratio is that it considers market capitalization, but not the balance sheet. So it won't reflect the advantage of cash, or disadvantage of debt. The exact same company would hypothetically deserve a higher P/E ratio if it had a strong balance sheet, than if it had a weak one with lots of debt, because a cashed up company can spend on growth.
Such spending might be good or bad, overall, but the key point here is that you need to look at debt to understand the P/E ratio in context.
So What Does Heidelberger Druckmaschinen's Balance Sheet Tell Us?
Net debt totals a substantial 103% of Heidelberger Druckmaschinen's market cap. If you want to compare its P/E ratio to other companies, you must keep in mind that these debt levels would usually warrant a relatively low P/E.
The Verdict On Heidelberger Druckmaschinen's P/E Ratio
Heidelberger Druckmaschinen trades on a P/E ratio of 30.7, which is above its market average of 20.8. While its debt levels are rather high, at least its EPS is growing quickly. So despite the debt it is, perhaps, not unreasonable to see a high P/E ratio.
Investors have an opportunity when market expectations about a stock are wrong. If the reality for a company is better than it expects, you can make money by buying and holding for the long term. So this free visualization of the analyst consensus on future earnings could help you make the right decision about whether to buy, sell, or hold.
You might be able to find a better buy than Heidelberger Druckmaschinen. If you want a selection of possible winners, check out this free list of interesting companies that trade on a P/E below 20 (but have proven they can grow earnings).
If you spot an error that warrants correction, please contact the editor at editorial-team@simplywallst.com. This article by Simply Wall St is general in nature. It does not constitute a recommendation to buy or sell any stock, and does not take account of your objectives, or your financial situation. Simply Wall St has no position in the stocks mentioned.
We aim to bring you long-term focused research analysis driven by fundamental data. Note that our analysis may not factor in the latest price-sensitive company announcements or qualitative material. Thank you for reading.
