Why Helix Energy Solutions Group, Inc.’s (NYSE:HLX) Return On Capital Employed Looks Uninspiring

Want to participate in a short research study? Help shape the future of investing tools and receive a $20 prize!
Today we’ll evaluate Helix Energy Solutions Group, Inc. (NYSE:HLX) to determine whether it could have potential as an investment idea. Specifically, we’ll consider its Return On Capital Employed (ROCE), since that will give us an insight into how efficiently the business can generate profits from the capital it requires.
Firstly, we’ll go over how we calculate ROCE. Second, we’ll look at its ROCE compared to similar companies. And finally, we’ll look at how its current liabilities are impacting its ROCE.
Return On Capital Employed (ROCE): What is it?
ROCE is a measure of a company’s yearly pre-tax profit (its return), relative to the capital employed in the business. In general, businesses with a higher ROCE are usually better quality. Ultimately, it is a useful but imperfect metric. Author Edwin Whiting says to be careful when comparing the ROCE of different businesses, since ‘No two businesses are exactly alike.’
How Do You Calculate Return On Capital Employed?
Analysts use this formula to calculate return on capital employed:
Return on Capital Employed = Earnings Before Interest and Tax (EBIT) ÷ (Total Assets – Current Liabilities)
Or for Helix Energy Solutions Group:
0.024 = US$51m ÷ (US$2.3b – US$191m) (Based on the trailing twelve months to December 2018.)
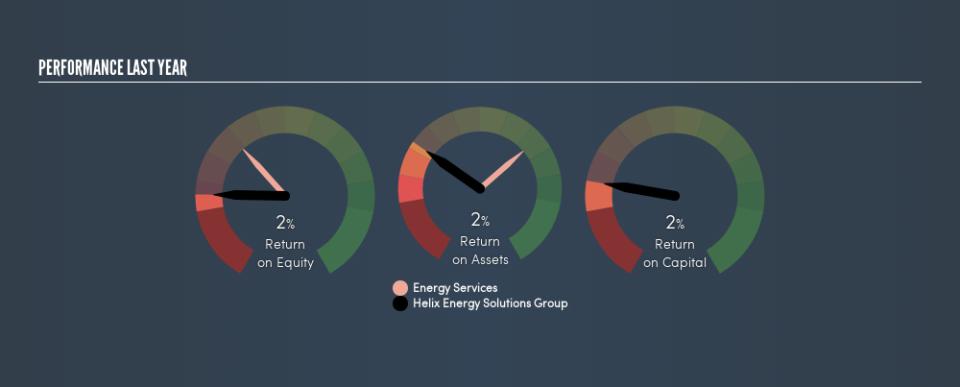
Therefore, Helix Energy Solutions Group has an ROCE of 2.4%.
See our latest analysis for Helix Energy Solutions Group
Is Helix Energy Solutions Group’s ROCE Good?
When making comparisons between similar businesses, investors may find ROCE useful. In this analysis, Helix Energy Solutions Group’s ROCE appears meaningfully below the 7.4% average reported by the Energy Services industry. This could be seen as a negative, as it suggests some competitors may be employing their capital more efficiently. Independently of how Helix Energy Solutions Group compares to its industry, its ROCE in absolute terms is low; especially compared to the ~2.7% available in government bonds. Readers may wish to look for more rewarding investments.
It is important to remember that ROCE shows past performance, and is not necessarily predictive. ROCE can be deceptive for cyclical businesses, as returns can look incredible in boom times, and terribly low in downturns. This is because ROCE only looks at one year, instead of considering returns across a whole cycle. Remember that most companies like Helix Energy Solutions Group are cyclical businesses. Future performance is what matters, and you can see analyst predictions in our free report on analyst forecasts for the company.
How Helix Energy Solutions Group’s Current Liabilities Impact Its ROCE
Short term (or current) liabilities, are things like supplier invoices, overdrafts, or tax bills that need to be paid within 12 months. Due to the way the ROCE equation works, having large bills due in the near term can make it look as though a company has less capital employed, and thus a higher ROCE than usual. To counter this, investors can check if a company has high current liabilities relative to total assets.
Helix Energy Solutions Group has total liabilities of US$191m and total assets of US$2.3b. Therefore its current liabilities are equivalent to approximately 8.2% of its total assets. Helix Energy Solutions Group has a low level of current liabilities, which have a negligible impact on its already low ROCE.
What We Can Learn From Helix Energy Solutions Group’s ROCE
Nevertheless, there are potentially more attractive companies to invest in. Of course, you might find a fantastic investment by looking at a few good candidates. So take a peek at this free list of companies with modest (or no) debt, trading on a P/E below 20.
I will like Helix Energy Solutions Group better if I see some big insider buys. While we wait, check out this free list of growing companies with considerable, recent, insider buying.
We aim to bring you long-term focused research analysis driven by fundamental data. Note that our analysis may not factor in the latest price-sensitive company announcements or qualitative material.
If you spot an error that warrants correction, please contact the editor at editorial-team@simplywallst.com. This article by Simply Wall St is general in nature. It does not constitute a recommendation to buy or sell any stock, and does not take account of your objectives, or your financial situation. Simply Wall St has no position in the stocks mentioned. Thank you for reading.
