Why Helmerich & Payne, Inc.’s (NYSE:HP) Return On Capital Employed Looks Uninspiring

Today we’ll look at Helmerich & Payne, Inc. (NYSE:HP) and reflect on its potential as an investment. In particular, we’ll consider its Return On Capital Employed (ROCE), as that can give us insight into how profitably the company is able to employ capital in its business.
First, we’ll go over how we calculate ROCE. Next, we’ll compare it to others in its industry. Last but not least, we’ll look at what impact its current liabilities have on its ROCE.
Understanding Return On Capital Employed (ROCE)
ROCE measures the amount of pre-tax profits a company can generate from the capital employed in its business. All else being equal, a better business will have a higher ROCE. Ultimately, it is a useful but imperfect metric. Author Edwin Whiting says to be careful when comparing the ROCE of different businesses, since ‘No two businesses are exactly alike.’
How Do You Calculate Return On Capital Employed?
The formula for calculating the return on capital employed is:
Return on Capital Employed = Earnings Before Interest and Tax (EBIT) ÷ (Total Assets – Current Liabilities)
Or for Helmerich & Payne:
0.013 = US$78m ÷ (US$6.2b – US$377m) (Based on the trailing twelve months to September 2018.)
So, Helmerich & Payne has an ROCE of 1.3%.
See our latest analysis for Helmerich & Payne
Is Helmerich & Payne’s ROCE Good?
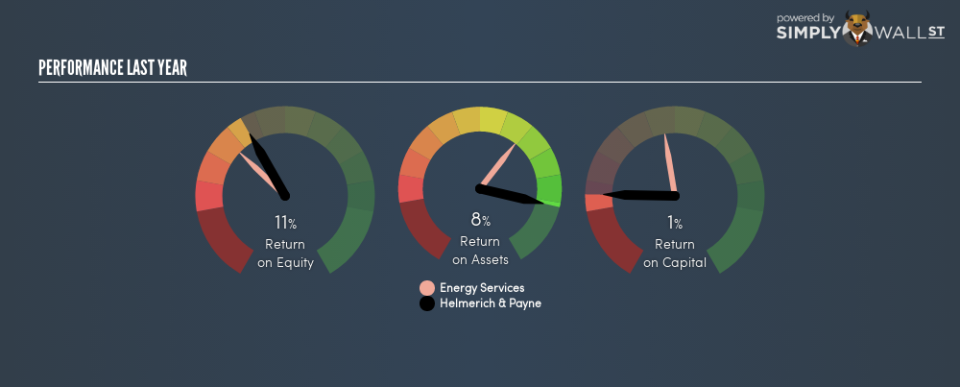
One way to assess ROCE is to compare similar companies. Using our data, Helmerich & Payne’s ROCE appears to be significantly below the 6.3% average in the Energy Services industry. This performance could be negative if sustained, as it suggests the business may underperform its industry. Independently of how Helmerich & Payne compares to its industry, its ROCE in absolute terms is low; especially compared to the ~2.7% available in government bonds. Readers may wish to look for more rewarding investments.
Helmerich & Payne’s current ROCE of 1.3% is lower than 3 years ago, when the company reported a 11% ROCE. So investors might consider if it has had issues recently.
Remember that this metric is backwards looking – it shows what has happened in the past, and does not accurately predict the future. Companies in cyclical industries can be difficult to understand using ROCE, as returns typically look high during boom times, and low during busts. ROCE is only a point-in-time measure. We note Helmerich & Payne could be considered a cyclical business. Future performance is what matters, and you can see analyst predictions in our free report on analyst forecasts for the company.
What Are Current Liabilities, And How Do They Affect Helmerich & Payne’s ROCE?
Current liabilities include invoices, such as supplier payments, short-term debt, or a tax bill, that need to be paid within 12 months. The ROCE equation subtracts current liabilities from capital employed, so a company with a lot of current liabilities appears to have less capital employed, and a higher ROCE than otherwise. To check the impact of this, we calculate if a company has high current liabilities relative to its total assets.
Helmerich & Payne has total liabilities of US$377m and total assets of US$6.2b. As a result, its current liabilities are equal to approximately 6.1% of its total assets. Helmerich & Payne has very few current liabilities, which have a minimal effect on its already low ROCE.
Our Take On Helmerich & Payne’s ROCE
Nevertheless, there are potentially more attractive companies to invest in. But note: Helmerich & Payne may not be the best stock to buy. So take a peek at this free list of interesting companies with strong recent earnings growth (and a P/E ratio below 20).
If you like to buy stocks alongside management, then you might just love this free list of companies. (Hint: insiders have been buying them).
To help readers see past the short term volatility of the financial market, we aim to bring you a long-term focused research analysis purely driven by fundamental data. Note that our analysis does not factor in the latest price-sensitive company announcements.
The author is an independent contributor and at the time of publication had no position in the stocks mentioned. For errors that warrant correction please contact the editor at editorial-team@simplywallst.com.
