Why Hurco Companies, Inc.’s (NASDAQ:HURC) Use Of Investor Capital Doesn’t Look Great

Today we are going to look at Hurco Companies, Inc. (NASDAQ:HURC) to see whether it might be an attractive investment prospect. To be precise, we'll consider its Return On Capital Employed (ROCE), as that will inform our view of the quality of the business.
First of all, we'll work out how to calculate ROCE. Next, we'll compare it to others in its industry. Last but not least, we'll look at what impact its current liabilities have on its ROCE.
Return On Capital Employed (ROCE): What is it?
ROCE measures the amount of pre-tax profits a company can generate from the capital employed in its business. All else being equal, a better business will have a higher ROCE. Ultimately, it is a useful but imperfect metric. Renowned investment researcher Michael Mauboussin has suggested that a high ROCE can indicate that 'one dollar invested in the company generates value of more than one dollar'.
So, How Do We Calculate ROCE?
The formula for calculating the return on capital employed is:
Return on Capital Employed = Earnings Before Interest and Tax (EBIT) ÷ (Total Assets - Current Liabilities)
Or for Hurco Companies:
0.043 = US$11m ÷ (US$301m - US$47m) (Based on the trailing twelve months to January 2020.)
Therefore, Hurco Companies has an ROCE of 4.3%.
View our latest analysis for Hurco Companies
Is Hurco Companies's ROCE Good?
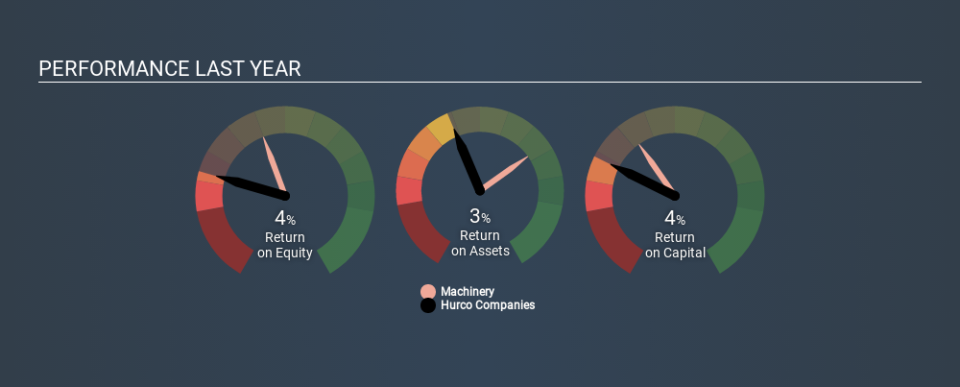
When making comparisons between similar businesses, investors may find ROCE useful. We can see Hurco Companies's ROCE is meaningfully below the Machinery industry average of 10%. This could be seen as a negative, as it suggests some competitors may be employing their capital more efficiently. Regardless of how Hurco Companies stacks up against its industry, its ROCE in absolute terms is quite low (especially compared to a bank account). Readers may wish to look for more rewarding investments.
Hurco Companies's current ROCE of 4.3% is lower than its ROCE in the past, which was 7.8%, 3 years ago. This makes us wonder if the business is facing new challenges. You can see in the image below how Hurco Companies's ROCE compares to its industry. Click to see more on past growth.
Remember that this metric is backwards looking - it shows what has happened in the past, and does not accurately predict the future. Companies in cyclical industries can be difficult to understand using ROCE, as returns typically look high during boom times, and low during busts. ROCE is only a point-in-time measure. If Hurco Companies is cyclical, it could make sense to check out this free graph of past earnings, revenue and cash flow.
Do Hurco Companies's Current Liabilities Skew Its ROCE?
Current liabilities include invoices, such as supplier payments, short-term debt, or a tax bill, that need to be paid within 12 months. The ROCE equation subtracts current liabilities from capital employed, so a company with a lot of current liabilities appears to have less capital employed, and a higher ROCE than otherwise. To check the impact of this, we calculate if a company has high current liabilities relative to its total assets.
Hurco Companies has total assets of US$301m and current liabilities of US$47m. As a result, its current liabilities are equal to approximately 16% of its total assets. This is a modest level of current liabilities, which will have a limited impact on the ROCE.
Our Take On Hurco Companies's ROCE
While that is good to see, Hurco Companies has a low ROCE and does not look attractive in this analysis. But note: make sure you look for a great company, not just the first idea you come across. So take a peek at this free list of interesting companies with strong recent earnings growth (and a P/E ratio below 20).
I will like Hurco Companies better if I see some big insider buys. While we wait, check out this free list of growing companies with considerable, recent, insider buying.
Love or hate this article? Concerned about the content? Get in touch with us directly. Alternatively, email editorial-team@simplywallst.com.
This article by Simply Wall St is general in nature. It does not constitute a recommendation to buy or sell any stock, and does not take account of your objectives, or your financial situation. We aim to bring you long-term focused analysis driven by fundamental data. Note that our analysis may not factor in the latest price-sensitive company announcements or qualitative material. Simply Wall St has no position in any stocks mentioned. Thank you for reading.
