Why Lexington Realty Trust (NYSE:LXP) May Not Be As Efficient As Its Industry

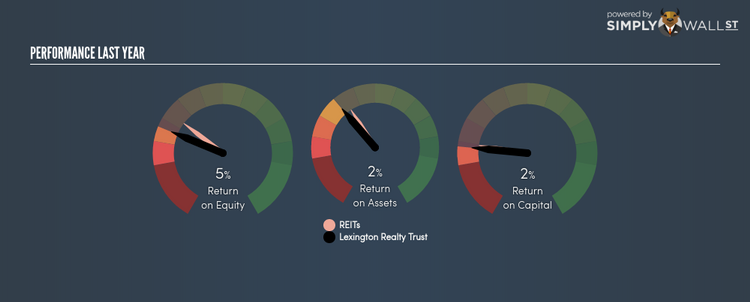
Lexington Realty Trust’s (NYSE:LXP) most recent return on equity was a substandard 5.20% relative to its industry performance of 7.56% over the past year. An investor may attribute an inferior ROE to a relatively inefficient performance, and whilst this can often be the case, knowing the nuts and bolts of the ROE calculation may change that perspective and give you a deeper insight into LXP’s past performance. Today I will look at how components such as financial leverage can influence ROE which may impact the sustainability of LXP’s returns. Check out our latest analysis for Lexington Realty Trust
Breaking down ROE — the mother of all ratios
Firstly, Return on Equity, or ROE, is simply the percentage of last years’ earning against the book value of shareholders’ equity. An ROE of 5.20% implies $0.05 returned on every $1 invested. Generally speaking, a higher ROE is preferred; however, there are other factors we must also consider before making any conclusions.
Return on Equity = Net Profit ÷ Shareholders Equity
Returns are usually compared to costs to measure the efficiency of capital. Lexington Realty Trust’s cost of equity is 8.51%. Given a discrepancy of -3.32% between return and cost, this indicated that Lexington Realty Trust may be paying more for its capital than what it’s generating in return. ROE can be dissected into three distinct ratios: net profit margin, asset turnover, and financial leverage. This is called the Dupont Formula:
Dupont Formula
ROE = profit margin × asset turnover × financial leverage
ROE = (annual net profit ÷ sales) × (sales ÷ assets) × (assets ÷ shareholders’ equity)
ROE = annual net profit ÷ shareholders’ equity
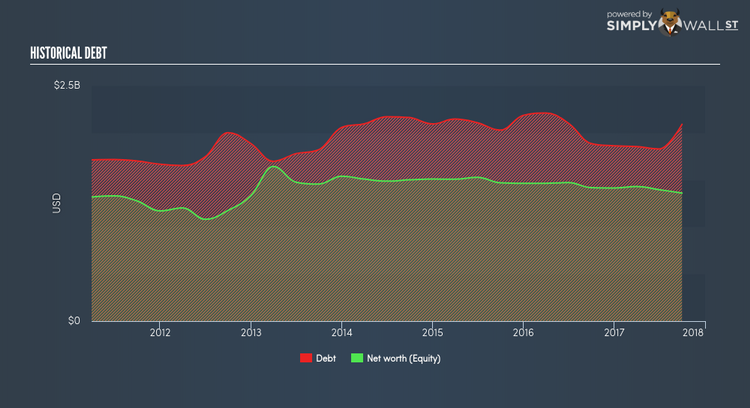
Basically, profit margin measures how much of revenue trickles down into earnings which illustrates how efficient the business is with its cost management. Asset turnover shows how much revenue Lexington Realty Trust can generate with its current asset base. The most interesting ratio, and reflective of sustainability of its ROE, is financial leverage. Since ROE can be inflated by excessive debt, we need to examine Lexington Realty Trust’s debt-to-equity level. At 153.65%, Lexington Realty Trust’s debt-to-equity ratio appears relatively high and indicates the below-average ROE is already being generated by significant leverage levels.
Next Steps:
ROE is a simple yet informative ratio, illustrating the various components that each measure the quality of the overall stock. Lexington Realty Trust’s ROE is underwhelming relative to the industry average, and its returns were also not strong enough to cover its own cost of equity. However, ROE is not likely to be inflated by excessive debt funding, giving shareholders more conviction in the sustainability of returns, which has headroom to increase further. ROE is a helpful signal, but it is definitely not sufficient on its own to make an investment decision.
For Lexington Realty Trust, I’ve put together three pertinent factors you should further research:
1. Financial Health: Does it have a healthy balance sheet? Take a look at our free balance sheet analysis with six simple checks on key factors like leverage and risk.
2. Valuation: What is Lexington Realty Trust worth today? Is the stock undervalued, even when its growth outlook is factored into its intrinsic value? The intrinsic value infographic in our free research report helps visualize whether Lexington Realty Trust is currently mispriced by the market.
3. Other High-Growth Alternatives : Are there other high-growth stocks you could be holding instead of Lexington Realty Trust? Explore our interactive list of stocks with large growth potential to get an idea of what else is out there you may be missing!
To help readers see pass the short term volatility of the financial market, we aim to bring you a long-term focused research analysis purely driven by fundamental data. Note that our analysis does not factor in the latest price sensitive company announcements.
The author is an independent contributor and at the time of publication had no position in the stocks mentioned.
