Why Is Moody's (MCO) Up 11.8% Since Its Last Earnings Report?

It has been about a month since the last earnings report for Moody's Corporation MCO. Shares have added about 11.8% in that time frame.
Will the recent positive trend continue leading up to its next earnings release, or is MCO due for a pullback? Before we dive into how investors and analysts have reacted as of late, let's take a quick look at the most recent earnings report in order to get a better handle on the important drivers.
Moody's Beats Q4 Earnings & Revenues, Issues '18 View
Moody's reported fourth-quarter 2017 adjusted earnings of $1.51 per share, which handily surpassed the Zacks Consensus Estimate of $1.45. Also, the bottom line improved 20% from the year-ago quarter.
Results were attributable to impressive revenue growth, reflecting strong issuance in the quarter. Also, both Moody’s Investors Service and Moody’s Analytics segments witnessed improved performance. However, higher expenses were on the downside.
After taking into consideration the impacts of tax reform in the United States and Europe, amortization of all acquisition-related intangible assets and acquisition-related expenses, Moody’s net income was $28.5 million or 13 cents per share. This compared favorably with net loss of $428.6 million or $2.25 per share incurred in the prior-year quarter.
For 2017, adjusted earnings of $6.07 per share, outpaced the Zacks Consensus Estimate of $6.00 and rose 23% year over year. Net income was $1.01 billion or $5.15 per share, up from $275.8 million or $1.36 per share in 2016.
Revenues Increase, Costs Rise
Quarterly revenues of $1.17 billion beat the Zacks Consensus Estimate of $1.08 billion. Also, revenues increased 24% year over year. The quarter witnessed higher domestic and international revenues. Foreign currency translation favorably impacted the top line by 3%.
For 2017, revenues of $4.2 billion surpassed the Zacks Consensus Estimate of $4.12 billion. Also, the figure jumped 17% year over year.
Total expenses were $702.7 million, down 50% from the prior-year quarter. The year-ago quarter included settlement charges of $863.8 million. Excluding this, expenses were up 27% year over year. Higher accruals for incentive compensation, Bureau van Dijk operating expenses and acquisition-related costs were the main reasons for the rise.
Adjusted operating income of $518.5 million jumped 22% year over year. Adjusted operating margin came in at 44.5%, up from 45% in the year-ago quarter.
Segment Performance Improves in Q4
Moody’s Investors Service revenues increased 19% year over year to $724.7 million, driven by growth in U.S. revenues as well as international revenues.
Corporate finance revenues improved, driven by strong U.S. investment grade and speculative grade bond, EMEA speculative grade bonds and bank loans, and Asian investment grade bond issuances. Also, structured finance revenues witnessed a rise mainly driven by increased issuance of U.S. and Europe CLOs and a rise in rated U.S. REIT transactions.
Further, financial institutions’ revenues improved, primarily reflecting rise in banking issuance from infrequent issuers. The company recorded a rise in global public, project and infrastructure finance revenues mainly driven by increased U.S. public finance issuance as well as strength in infrastructure finance.
Moody’s Analytics revenues jumped 32% year over year to $440.8 million, mainly driven by higher non-U.S. revenues. Notably, foreign currency translation favorably impacted revenues by 3%.
The segment recorded growth in research, data and analytics revenues, professional services revenues and Enterprise Risk Solutions revenues.
Balance Sheet
As of Dec 31, 2017, Moody’s had total cash, cash equivalents and short-term investments of $1.18 billion, down 47% from Dec 31, 2016 level. Further, the company had $5.54 billion of outstanding debt.
Share Repurchases
During the reported quarter, the company repurchased 0.2 million shares for $36.1 million.
2018 Guidance
Management anticipates earnings per share to be $7.20 to $7.40, while adjusted earnings (excluding nearly 40 cents per share of acquisition-related intangibles and roughly 5 cents per share related to acquisition-related expenses) are expected to be in the range of $7.65 to $7.85 per share. Both projections include a roughly 65 cents per share benefit resulting from the U.S. tax reform and an estimated 20 cents per share benefit related to the tax accounting for equity compensation (majority to be recognized in the first quarter of 2018).
Moody’s anticipates revenues to increase in the low-double-digit percent range. Operating expenses are projected to rise in the low-double-digit percent range.
Adjusted operating margin is expected to be approximately 48% and operating margin is expected to be in the 43-44% range.
Moody’s expects cash flow from operations to be about $1.7 billion and free cash flow of about $1.6 billion. Capital expenditures are likely to be about $120 million while depreciation and amortization expenses are estimated to be around $200 million.
Share repurchases are estimated to be $200 million. Moody’s kept the dividend payout ratio of 25-30% intact.
The effective tax rate is expected to be in the range of 22-23%.
Segment Outlook for 2018
MIS segment revenues are likely to increase in the mid-single-digit percent range. The company expects U.S. revenues to rise in the low-single-digit percent range while non-U.S. revenues are projected to grow in the high-single-digit percent range.
Also, corporate finance revenues are expected to increase in high-single-digit percent range while both financial institutions revenues and structured finance revenues will likely grow in the mid-single-digit percent range. However, public, project and infrastructure finance revenues are expected to decline in the low-single-digit percent range.
Regarding MA segment, Moody’s anticipates revenues to grow in the mid-20s percent range. Excluding Bureau van Dijk, segment revenues are expected to rise in the low-double-digit percent range.
U.S. revenues are expected to increase in the low-double-digit percent range while non-U.S. revenues are estimated to be up in the mid-30s percent range.
Research, data and analytics revenues are expected to increase nearly 40%. Excluding Bureau van Dijk, RD&A revenues are expected to increase in the mid-teens percent range. Revenue contribution from Bureau van Dijk will be reduced approximately $16 million due to a deferred revenue adjustment required as part of acquisition accounting.
Further, enterprise risk solutions revenues are likely to grow in the low-single-digit percent range while professional services revenues are anticipated to increase in the high-single-digit percent range.
How Have Estimates Been Moving Since Then?
In the past month, investors have witnessed an upward trend in fresh estimates. There has been one revision higher for the current quarter.
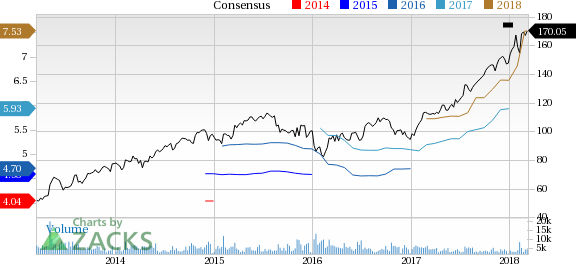
Moody's Corporation Price and Consensus
Moody's Corporation Price and Consensus | Moody's Corporation Quote
VGM Scores
At this time, MCO has a subpar Growth Score of D, however its Momentum is doing a lot better with an A. However, the stock was allocated a grade of F on the value side, putting it in the fifth quintile for this investment strategy.
Overall, the stock has an aggregate VGM Score of F. If you aren't focused on one strategy, this score is the one you should be interested in.
The company's stock is suitable solely for momentum based on our styles scores.
Outlook
Estimates have been trending upward for the stock and the magnitude of this revision looks promising. It comes with little surprise MCO has a Zacks Rank #2 (Buy). We expect an above average return from the stock in the next few months.
Want the latest recommendations from Zacks Investment Research? Today, you can download 7 Best Stocks for the Next 30 Days. Click to get this free report
Moody's Corporation (MCO) : Free Stock Analysis Report
To read this article on Zacks.com click here.
Zacks Investment Research
