Why We’re Not Keen On Radware Ltd.’s (NASDAQ:RDWR) 0.07% Return On Capital

Want to participate in a short research study? Help shape the future of investing tools and you could win a $250 gift card!
Today we’ll evaluate Radware Ltd. (NASDAQ:RDWR) to determine whether it could have potential as an investment idea. Specifically, we’re going to calculate its Return On Capital Employed (ROCE), in the hopes of getting some insight into the business.
First, we’ll go over how we calculate ROCE. Second, we’ll look at its ROCE compared to similar companies. Then we’ll determine how its current liabilities are affecting its ROCE.
Return On Capital Employed (ROCE): What is it?
ROCE measures the amount of pre-tax profits a company can generate from the capital employed in its business. Generally speaking a higher ROCE is better. Ultimately, it is a useful but imperfect metric. Renowned investment researcher Michael Mauboussin has suggested that a high ROCE can indicate that ‘one dollar invested in the company generates value of more than one dollar’.
How Do You Calculate Return On Capital Employed?
The formula for calculating the return on capital employed is:
Return on Capital Employed = Earnings Before Interest and Tax (EBIT) ÷ (Total Assets – Current Liabilities)
Or for Radware:
0.00067 = -US$11.7m ÷ (US$514m – US$113m) (Based on the trailing twelve months to September 2018.)
Therefore, Radware has an ROCE of 0.07%.
View our latest analysis for Radware
Does Radware Have A Good ROCE?
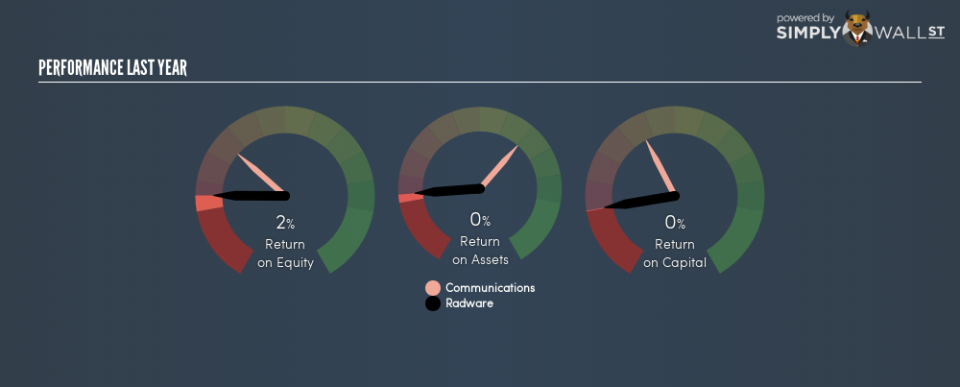
When making comparisons between similar businesses, investors may find ROCE useful. In this analysis, Radware’s ROCE appears meaningfully below the 7.9% average reported by the Communications industry. This performance could be negative if sustained, as it suggests the business may underperform its industry. Independently of how Radware compares to its industry, its ROCE in absolute terms is low; especially compared to the ~2.7% available in government bonds. It is likely that there are more attractive prospects out there.
Radware’s current ROCE of 0.07% is lower than its ROCE in the past, which was 8.7%, 3 years ago. Therefore we wonder if the company is facing new headwinds.
Remember that this metric is backwards looking – it shows what has happened in the past, and does not accurately predict the future. Companies in cyclical industries can be difficult to understand using ROCE, as returns typically look high during boom times, and low during busts. ROCE is only a point-in-time measure. Future performance is what matters, and you can see analyst predictions in our free report on analyst forecasts for the company.
What Are Current Liabilities, And How Do They Affect Radware’s ROCE?
Liabilities, such as supplier bills and bank overdrafts, are referred to as current liabilities if they need to be paid within 12 months. Due to the way ROCE is calculated, a high level of current liabilities makes a company look as though it has less capital employed, and thus can (sometimes unfairly) boost the ROCE. To counteract this, we check if a company has high current liabilities, relative to its total assets.
Radware has total assets of US$514m and current liabilities of US$113m. As a result, its current liabilities are equal to approximately 22% of its total assets. With a very reasonable level of current liabilities, so the impact on ROCE is fairly minimal.
The Bottom Line On Radware’s ROCE
Radware has a poor ROCE, and there may be better investment prospects out there. You might be able to find a better buy than Radware. If you want a selection of possible winners, check out this free list of interesting companies that trade on a P/E below 20 (but have proven they can grow earnings).
If you are like me, then you will not want to miss this free list of growing companies that insiders are buying.
To help readers see past the short term volatility of the financial market, we aim to bring you a long-term focused research analysis purely driven by fundamental data. Note that our analysis does not factor in the latest price-sensitive company announcements.
The author is an independent contributor and at the time of publication had no position in the stocks mentioned. For errors that warrant correction please contact the editor at editorial-team@simplywallst.com.
