Why We’re Not Keen On The Star Entertainment Group Limited’s (ASX:SGR) 6.2% Return On Capital

Today we are going to look at The Star Entertainment Group Limited (ASX:SGR) to see whether it might be an attractive investment prospect. Specifically, we're going to calculate its Return On Capital Employed (ROCE), in the hopes of getting some insight into the business.
First up, we'll look at what ROCE is and how we calculate it. Second, we'll look at its ROCE compared to similar companies. Finally, we'll look at how its current liabilities affect its ROCE.
What is Return On Capital Employed (ROCE)?
ROCE is a metric for evaluating how much pre-tax income (in percentage terms) a company earns on the capital invested in its business. All else being equal, a better business will have a higher ROCE. In brief, it is a useful tool, but it is not without drawbacks. Author Edwin Whiting says to be careful when comparing the ROCE of different businesses, since 'No two businesses are exactly alike.
How Do You Calculate Return On Capital Employed?
Analysts use this formula to calculate return on capital employed:
Return on Capital Employed = Earnings Before Interest and Tax (EBIT) ÷ (Total Assets - Current Liabilities)
Or for Star Entertainment Group:
0.062 = AU$303m ÷ (AU$5.6b - AU$674m) (Based on the trailing twelve months to June 2019.)
So, Star Entertainment Group has an ROCE of 6.2%.
Check out our latest analysis for Star Entertainment Group
Is Star Entertainment Group's ROCE Good?
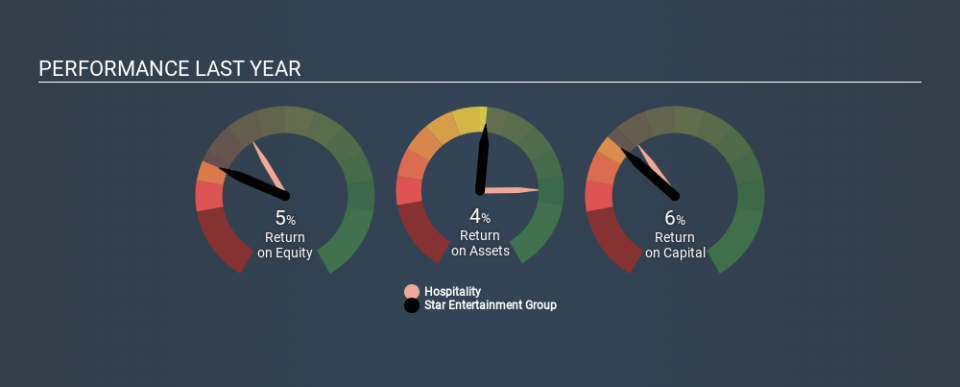
One way to assess ROCE is to compare similar companies. Using our data, Star Entertainment Group's ROCE appears to be significantly below the 12% average in the Hospitality industry. This performance is not ideal, as it suggests the company may not be deploying its capital as effectively as some competitors. Setting aside the industry comparison for now, Star Entertainment Group's ROCE is mediocre in absolute terms, considering the risk of investing in stocks versus the safety of a bank account. Readers may find more attractive investment prospects elsewhere.
The image below shows how Star Entertainment Group's ROCE compares to its industry, and you can click it to see more detail on its past growth.
When considering this metric, keep in mind that it is backwards looking, and not necessarily predictive. ROCE can be misleading for companies in cyclical industries, with returns looking impressive during the boom times, but very weak during the busts. This is because ROCE only looks at one year, instead of considering returns across a whole cycle. Future performance is what matters, and you can see analyst predictions in our free report on analyst forecasts for the company.
What Are Current Liabilities, And How Do They Affect Star Entertainment Group's ROCE?
Liabilities, such as supplier bills and bank overdrafts, are referred to as current liabilities if they need to be paid within 12 months. Due to the way ROCE is calculated, a high level of current liabilities makes a company look as though it has less capital employed, and thus can (sometimes unfairly) boost the ROCE. To check the impact of this, we calculate if a company has high current liabilities relative to its total assets.
Star Entertainment Group has total assets of AU$5.6b and current liabilities of AU$674m. As a result, its current liabilities are equal to approximately 12% of its total assets. This very reasonable level of current liabilities would not boost the ROCE by much.
Our Take On Star Entertainment Group's ROCE
With that in mind, we're not overly impressed with Star Entertainment Group's ROCE, so it may not be the most appealing prospect. But note: make sure you look for a great company, not just the first idea you come across. So take a peek at this free list of interesting companies with strong recent earnings growth (and a P/E ratio below 20).
If you are like me, then you will not want to miss this free list of growing companies that insiders are buying.
If you spot an error that warrants correction, please contact the editor at editorial-team@simplywallst.com. This article by Simply Wall St is general in nature. It does not constitute a recommendation to buy or sell any stock, and does not take account of your objectives, or your financial situation. Simply Wall St has no position in the stocks mentioned.
We aim to bring you long-term focused research analysis driven by fundamental data. Note that our analysis may not factor in the latest price-sensitive company announcements or qualitative material. Thank you for reading.
