Why We Like Prosegur Cash, S.A.’s (BME:CASH) 25% Return On Capital Employed

Today we'll look at Prosegur Cash, S.A. (BME:CASH) and reflect on its potential as an investment. In particular, we'll consider its Return On Capital Employed (ROCE), as that can give us insight into how profitably the company is able to employ capital in its business.
First up, we'll look at what ROCE is and how we calculate it. Next, we'll compare it to others in its industry. Last but not least, we'll look at what impact its current liabilities have on its ROCE.
Understanding Return On Capital Employed (ROCE)
ROCE measures the amount of pre-tax profits a company can generate from the capital employed in its business. Generally speaking a higher ROCE is better. In brief, it is a useful tool, but it is not without drawbacks. Renowned investment researcher Michael Mauboussin has suggested that a high ROCE can indicate that 'one dollar invested in the company generates value of more than one dollar'.
How Do You Calculate Return On Capital Employed?
The formula for calculating the return on capital employed is:
Return on Capital Employed = Earnings Before Interest and Tax (EBIT) ÷ (Total Assets - Current Liabilities)
Or for Prosegur Cash:
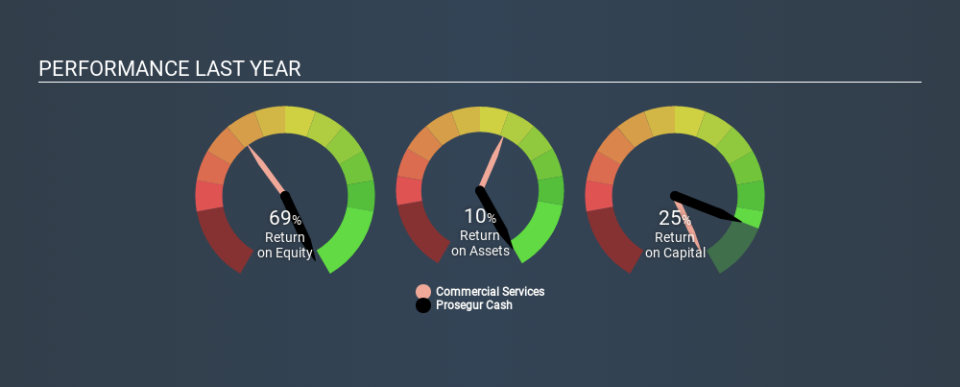
0.25 = €291m ÷ (€1.9b - €788m) (Based on the trailing twelve months to December 2019.)
So, Prosegur Cash has an ROCE of 25%.
Check out our latest analysis for Prosegur Cash
Does Prosegur Cash Have A Good ROCE?
ROCE is commonly used for comparing the performance of similar businesses. In our analysis, Prosegur Cash's ROCE is meaningfully higher than the 9.7% average in the Commercial Services industry. We would consider this a positive, as it suggests it is using capital more effectively than other similar companies. Regardless of the industry comparison, in absolute terms, Prosegur Cash's ROCE currently appears to be excellent.
Prosegur Cash's current ROCE of 25% is lower than 3 years ago, when the company reported a 35% ROCE. Therefore we wonder if the company is facing new headwinds. The image below shows how Prosegur Cash's ROCE compares to its industry, and you can click it to see more detail on its past growth.
It is important to remember that ROCE shows past performance, and is not necessarily predictive. Companies in cyclical industries can be difficult to understand using ROCE, as returns typically look high during boom times, and low during busts. ROCE is, after all, simply a snap shot of a single year. What happens in the future is pretty important for investors, so we have prepared a free report on analyst forecasts for Prosegur Cash.
Do Prosegur Cash's Current Liabilities Skew Its ROCE?
Current liabilities include invoices, such as supplier payments, short-term debt, or a tax bill, that need to be paid within 12 months. Due to the way the ROCE equation works, having large bills due in the near term can make it look as though a company has less capital employed, and thus a higher ROCE than usual. To check the impact of this, we calculate if a company has high current liabilities relative to its total assets.
Prosegur Cash has current liabilities of €788m and total assets of €1.9b. Therefore its current liabilities are equivalent to approximately 41% of its total assets. Prosegur Cash's ROCE is boosted somewhat by its middling amount of current liabilities.
The Bottom Line On Prosegur Cash's ROCE
Still, it has a high ROCE, and may be an interesting prospect for further research. Prosegur Cash looks strong on this analysis, but there are plenty of other companies that could be a good opportunity . Here is a free list of companies growing earnings rapidly.
If you like to buy stocks alongside management, then you might just love this free list of companies. (Hint: insiders have been buying them).
If you spot an error that warrants correction, please contact the editor at editorial-team@simplywallst.com. This article by Simply Wall St is general in nature. It does not constitute a recommendation to buy or sell any stock, and does not take account of your objectives, or your financial situation. Simply Wall St has no position in the stocks mentioned.
We aim to bring you long-term focused research analysis driven by fundamental data. Note that our analysis may not factor in the latest price-sensitive company announcements or qualitative material. Thank you for reading.
