Why Is Realty Income (O) Up 3.1% Since Its Last Earnings Report?

A month has gone by since the last earnings report for Realty Income Corporation O. Shares have added about 3.1% in that time frame.
Will the recent positive trend continue leading up to its next earnings release, or is O due for a pullback? Before we dive into how investors and analysts have reacted as of late, let's take a quick look at the most recent earnings report in order to get a better handle on the important drivers.
Realty Income Q4 FFO Misses Estimates, Revenues Grow Y/Y
Realty Income’s fourth-quarter 2017 adjusted FFO per share of 76 cents inched up 1.3% year over year. However, the figure missed the Zacks Consensus Estimate by a penny.
The company benefited from revenue growth in the fourth quarter. It achieved growth in same-store rents and guided annual increase of 3-5% in adjusted FFO per share for full-year 2018.
Total revenues for the reported quarter came in at $310.7 million, surpassing the Zacks Consensus Estimate of $306.9 million. Revenues were also up 8.0% year over year.
For full-year 2017, adjusted FFO per share came in at $3.06, well ahead of the prior-year tally of $2.88. This was backed by 10.2% year-over-year growth in total revenues to $1.2 billion.
Quarter in Detail
During fourth-quarter 2017, same-store rents on 4,254 properties under lease expanded 1.0% to $244.9 million from the prior-year quarter. Portfolio occupancy of 98.4% as of Dec 31, 2017, expanded 10 basis points year over year.
Further, the company had 83 properties available for lease, out of a total of 5,172 properties in the portfolio as of Dec 31, 2017, compared with 86 properties as of Sep 30, 2017. Moreover, during the reported quarter, it re-leased 78 properties to existing and new tenants, at a rent recapture rate of 102.2%.
Portfolio Activity
Solid property acquisitions volume at decent investment spreads aided the company’s performance. During the reported quarter, Realty Income invested $562.6 million in 130 new properties and properties under development or expansion, situated in 27 states. The assets are fully leased, with a weighted average lease term of around 13.6 years, and an initial average cash lease yield of 6.3%. Around 65% of the rental revenues from acquisitions reported during the quarter are from investment grade-rated tenants.
On the other hand, during the quarter, the company sold 13 properties for $97.5 million, with a gain on sales of $23.2 million.
Liquidity
Finally, Realty Income exited 2017 with cash and cash equivalents of $6.9 million, down from $9.4 million at the end of the prior year.
However, the company has a $2.25-billion unsecured credit facility, comprising $2.0 billion revolving credit facility and a $250-million five-year unsecured term loan. The credit facility also bears a $1.0-billion expansion feature. As of Dec 31, 2017, Realty Income had borrowing capacity of $1.89 billion available on its revolving credit facility.
Furthermore, Realty Income raised $135.8 million from the sale of common stock at a weighted average price of $55.54 per share during the fourth quarter.
Outlook
For full-year 2018, Realty Income initiated its adjusted FFO per share guidance in the range of $3.14-$3.20, marking annual increase of 3-5%.
Based on the prevailing market conditions, the company expects to acquire $1.0-$1.5 billion in real estate investments.
How Have Estimates Been Moving Since Then?
It turns out, fresh estimates have trended upward during the past month. There have been three revisions higher for the current quarter compared to one lower.
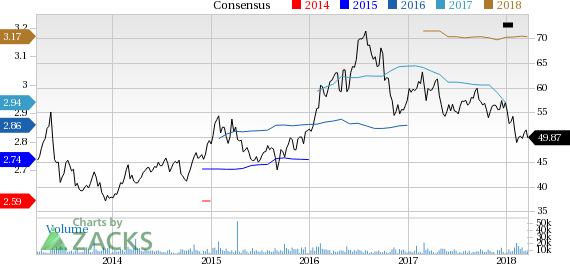
Realty Income Corporation Price and Consensus
Realty Income Corporation Price and Consensus | Realty Income Corporation Quote
VGM Scores
At this time, O has an average Growth Score of C, however its Momentum is doing a bit better with a B. However, the stock was allocated a grade of D on the value side, putting it in the bottom 40% for this investment strategy.
Overall, the stock has an aggregate VGM Score of D. If you aren't focused on one strategy, this score is the one you should be interested in.
Our style scores indicate that the stock is more suitable for momentum investors than growth investors.
Outlook
Estimates have been broadly trending upward for the stock and the magnitude of these revisions looks promising. Interestingly, O has a Zacks Rank #3 (Hold). We expect an in-line return from the stock in the next few months.
Want the latest recommendations from Zacks Investment Research? Today, you can download 7 Best Stocks for the Next 30 Days. Click to get this free report
Realty Income Corporation (O) : Free Stock Analysis Report
To read this article on Zacks.com click here.
