Why Rollins, Inc.’s (NYSE:ROL) High P/E Ratio Isn’t Necessarily A Bad Thing

Want to participate in a short research study? Help shape the future of investing tools and you could win a $250 gift card!
This article is written for those who want to get better at using price to earnings ratios (P/E ratios). To keep it practical, we’ll show how Rollins, Inc.’s (NYSE:ROL) P/E ratio could help you assess the value on offer. Rollins has a price to earnings ratio of 54.08, based on the last twelve months. That means that at current prices, buyers pay $54.08 for every $1 in trailing yearly profits.
Check out our latest analysis for Rollins
How Do You Calculate Rollins’s P/E Ratio?
The formula for P/E is:
Price to Earnings Ratio = Price per Share ÷ Earnings per Share (EPS)
Or for Rollins:
P/E of 54.08 = $38.28 ÷ $0.71 (Based on the year to December 2018.)
Is A High P/E Ratio Good?
A higher P/E ratio means that buyers have to pay a higher price for each $1 the company has earned over the last year. That isn’t a good or a bad thing on its own, but a high P/E means that buyers have a higher opinion of the business’s prospects, relative to stocks with a lower P/E.
How Growth Rates Impact P/E Ratios
Earnings growth rates have a big influence on P/E ratios. When earnings grow, the ‘E’ increases, over time. That means even if the current P/E is high, it will reduce over time if the share price stays flat. A lower P/E should indicate the stock is cheap relative to others — and that may attract buyers.
Notably, Rollins grew EPS by a whopping 29% in the last year. And its annual EPS growth rate over 5 years is 11%. With that performance, I would expect it to have an above average P/E ratio.
How Does Rollins’s P/E Ratio Compare To Its Peers?
The P/E ratio essentially measures market expectations of a company. The image below shows that Rollins has a higher P/E than the average (19.1) P/E for companies in the commercial services industry.
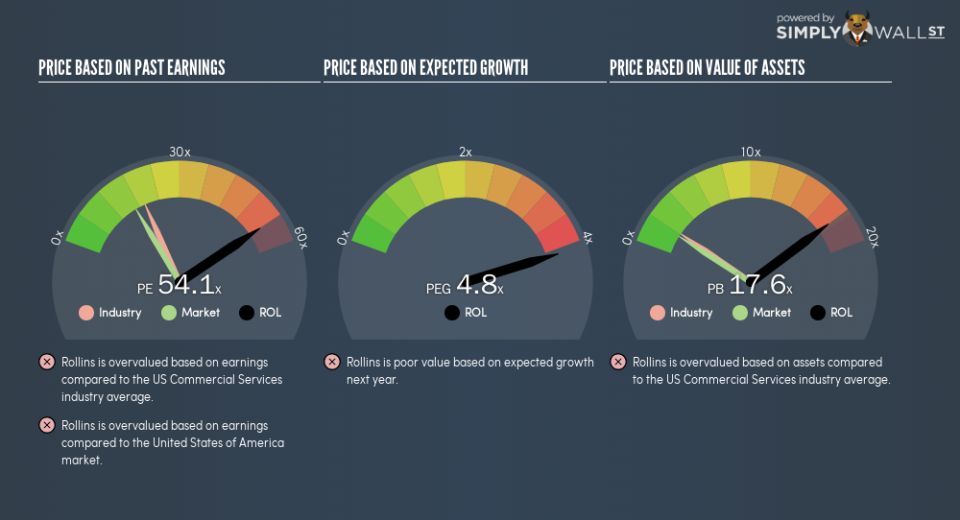
Rollins’s P/E tells us that market participants think the company will perform better than its industry peers, going forward. The market is optimistic about the future, but that doesn’t guarantee future growth. So investors should always consider the P/E ratio alongside other factors, such as whether company directors have been buying shares.
Remember: P/E Ratios Don’t Consider The Balance Sheet
It’s important to note that the P/E ratio considers the market capitalization, not the enterprise value. In other words, it does not consider any debt or cash that the company may have on the balance sheet. Theoretically, a business can improve its earnings (and produce a lower P/E in the future), by taking on debt (or spending its remaining cash).
Such expenditure might be good or bad, in the long term, but the point here is that the balance sheet is not reflected by this ratio.
Is Debt Impacting Rollins’s P/E?
Since Rollins holds net cash of US$115m, it can spend on growth, justifying a higher P/E ratio than otherwise.
The Bottom Line On Rollins’s P/E Ratio
Rollins has a P/E of 54.1. That’s significantly higher than the average in the US market, which is 16.8. With cash in the bank the company has plenty of growth options — and it is already on the right track. So it is not surprising the market is probably extrapolating recent growth well into the future, reflected in the relatively high P/E ratio.
Investors have an opportunity when market expectations about a stock are wrong. If the reality for a company is better than it expects, you can make money by buying and holding for the long term. So this free visual report on analyst forecasts could hold they key to an excellent investment decision.
Of course you might be able to find a better stock than Rollins. So you may wish to see this free collection of other companies that have grown earnings strongly.
To help readers see past the short term volatility of the financial market, we aim to bring you a long-term focused research analysis purely driven by fundamental data. Note that our analysis does not factor in the latest price-sensitive company announcements.
The author is an independent contributor and at the time of publication had no position in the stocks mentioned. For errors that warrant correction please contact the editor at editorial-team@simplywallst.com.
