Why Schneider National, Inc.'s (NYSE:SNDR) High P/E Ratio Isn't Necessarily A Bad Thing

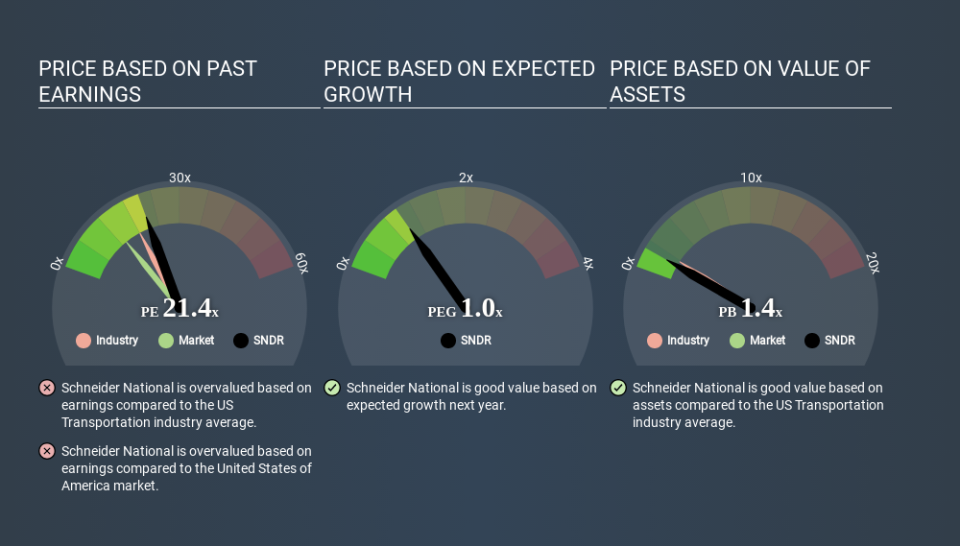
The goal of this article is to teach you how to use price to earnings ratios (P/E ratios). We'll look at Schneider National, Inc.'s (NYSE:SNDR) P/E ratio and reflect on what it tells us about the company's share price. What is Schneider National's P/E ratio? Well, based on the last twelve months it is 21.40. In other words, at today's prices, investors are paying $21.40 for every $1 in prior year profit.
See our latest analysis for Schneider National
How Do I Calculate A Price To Earnings Ratio?
The formula for P/E is:
Price to Earnings Ratio = Share Price ÷ Earnings per Share (EPS)
Or for Schneider National:
P/E of 21.40 = $17.760 ÷ $0.830 (Based on the trailing twelve months to December 2019.)
(Note: the above calculation results may not be precise due to rounding.)
Is A High P/E Ratio Good?
A higher P/E ratio means that investors are paying a higher price for each $1 of company earnings. All else being equal, it's better to pay a low price -- but as Warren Buffett said, 'It's far better to buy a wonderful company at a fair price than a fair company at a wonderful price'.
How Does Schneider National's P/E Ratio Compare To Its Peers?
We can get an indication of market expectations by looking at the P/E ratio. As you can see below, Schneider National has a higher P/E than the average company (17.5) in the transportation industry.
Its relatively high P/E ratio indicates that Schneider National shareholders think it will perform better than other companies in its industry classification. Shareholders are clearly optimistic, but the future is always uncertain. So further research is always essential. I often monitor director buying and selling.
How Growth Rates Impact P/E Ratios
Companies that shrink earnings per share quickly will rapidly decrease the 'E' in the equation. Therefore, even if you pay a low multiple of earnings now, that multiple will become higher in the future. Then, a higher P/E might scare off shareholders, pushing the share price down.
Schneider National saw earnings per share decrease by 45% last year. And over the longer term (5 years) earnings per share have decreased 50% annually. This growth rate might warrant a below average P/E ratio.
Remember: P/E Ratios Don't Consider The Balance Sheet
Don't forget that the P/E ratio considers market capitalization. In other words, it does not consider any debt or cash that the company may have on the balance sheet. Theoretically, a business can improve its earnings (and produce a lower P/E in the future) by investing in growth. That means taking on debt (or spending its cash).
Such spending might be good or bad, overall, but the key point here is that you need to look at debt to understand the P/E ratio in context.
Is Debt Impacting Schneider National's P/E?
Since Schneider National holds net cash of US$240m, it can spend on growth, justifying a higher P/E ratio than otherwise.
The Verdict On Schneider National's P/E Ratio
Schneider National trades on a P/E ratio of 21.4, which is above its market average of 13.0. Falling earnings per share is probably keeping traditional value investors away, but the relatively strong balance sheet will allow the company time to invest in growth. Clearly, the high P/E indicates shareholders think it will!
When the market is wrong about a stock, it gives savvy investors an opportunity. If the reality for a company is better than it expects, you can make money by buying and holding for the long term. So this free visualization of the analyst consensus on future earnings could help you make the right decision about whether to buy, sell, or hold.
You might be able to find a better buy than Schneider National. If you want a selection of possible winners, check out this free list of interesting companies that trade on a P/E below 20 (but have proven they can grow earnings).
If you spot an error that warrants correction, please contact the editor at editorial-team@simplywallst.com. This article by Simply Wall St is general in nature. It does not constitute a recommendation to buy or sell any stock, and does not take account of your objectives, or your financial situation. Simply Wall St has no position in the stocks mentioned.
We aim to bring you long-term focused research analysis driven by fundamental data. Note that our analysis may not factor in the latest price-sensitive company announcements or qualitative material. Thank you for reading.
