Why Shaw Communications Inc (TSX:SJRB) Delivered An Inferior ROE Compared To The Industry

Shaw Communications Inc (TSX:SJR.B) delivered a less impressive 8.77% ROE over the past year, compared to the 9.67% return generated by its industry. Though SJR.B's recent performance is underwhelming, it is useful to understand what ROE is made up of and how it should be interpreted. Knowing these components can change your views on SJR.B's below-average returns. Metrics such as financial leverage can impact the level of ROE which in turn can affect the sustainability of SJR.B's returns. Let me show you what I mean by this. View our latest analysis for Shaw Communications
Peeling the layers of ROE – trisecting a company’s profitability
Return on Equity (ROE) is a measure of SJR.B’s profit relative to its shareholders’ equity. For example, if SJR.B invests $1 in the form of equity, it will generate $0.09 in earnings from this. Generally speaking, a higher ROE is preferred; however, there are other factors we must also consider before making any conclusions.
Return on Equity = Net Profit ÷ Shareholders Equity
ROE is assessed against cost of equity, which is measured using the Capital Asset Pricing Model (CAPM) – but let’s not dive into the details of that today. For now, let’s just look at the cost of equity number for SJR.B, which is 8.49%. Some of SJR.B’s peers may have a higher ROE but its cost of equity could exceed this return, leading to an unsustainable negative discrepancy i.e. the company spends more than it earns. This is not the case for SJR.B which is reassuring. ROE can be dissected into three distinct ratios: net profit margin, asset turnover, and financial leverage. This is called the Dupont Formula:
Dupont Formula
ROE = profit margin × asset turnover × financial leverage
ROE = (annual net profit ÷ sales) × (sales ÷ assets) × (assets ÷ shareholders’ equity)
ROE = annual net profit ÷ shareholders’ equity

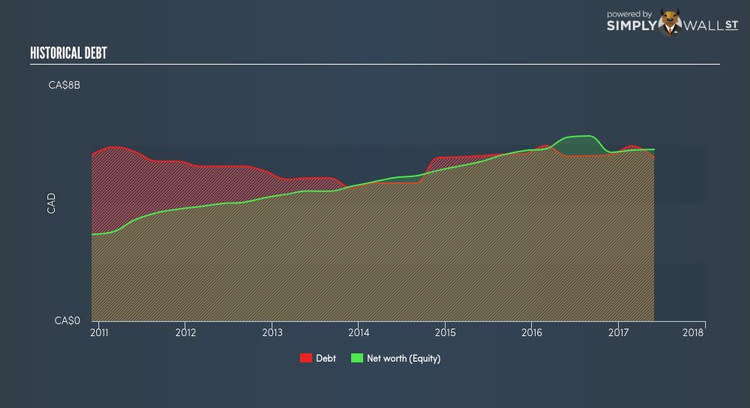
Basically, profit margin measures how much of revenue trickles down into earnings which illustrates how efficient SJR.B is with its cost management. Asset turnover reveals how much revenue can be generated from SJR.B’s asset base. And finally, financial leverage is simply how much of assets are funded by equity, which exhibits how sustainable SJR.B’s capital structure is. Since financial leverage can artificially inflate ROE, we need to look at how much debt SJR.B currently has. At 95.41%, SJR.B’s debt-to-equity ratio appears balanced and indicates its ROE is generated from its capacity to increase profit without a large debt burden.
What this means for you:
Are you a shareholder? Although SJR.B’s ROE is underwhelming relative to the industry average, its returns are high enough to cover the cost of equity, which is encouraging. Since its high ROE is not likely driven by high debt, it might be a good time to top up on your current holdings if your fundamental research reaffirms this analysis.
Are you a potential investor? If you are considering investing in SJR.B, looking at ROE on its own is not enough to make a well-informed decision. I recommend you do additional fundamental analysis by looking through our most recent infographic report on Shaw Communications to help you make a more informed investment decision. If you are not interested in SJR.B anymore, you can use our free platform to see our list of stocks with Return on Equity over 20%.
To help readers see pass the short term volatility of the financial market, we aim to bring you a long-term focused research analysis purely driven by fundamental data. Note that our analysis does not factor in the latest price sensitive company announcements.
The author is an independent contributor and at the time of publication had no position in the stocks mentioned.
