Why Simpson Manufacturing Co Inc. (NYSE:SSD) Delivered An Inferior ROE Compared To The Industry

Simpson Manufacturing Co Inc.’s (NYSE:SSD) most recent return on equity was a substandard 10.47% relative to its industry performance of 13.04% over the past year. Though SSD’s recent performance is underwhelming, it is useful to understand what ROE is made up of and how it should be interpreted. Knowing these components can change your views on SSD’s below-average returns. I will take you through how metrics such as financial leverage impact ROE which may affect the overall sustainability of SSD’s returns. See our latest analysis for Simpson Manufacturing
Peeling the layers of ROE – trisecting a company’s profitability
Return on Equity (ROE) weighs Simpson Manufacturing’s profit against the level of its shareholders’ equity. An ROE of 10.47% implies $0.1 returned on every $1 invested. In most cases, a higher ROE is preferred; however, there are many other factors we must consider prior to making any investment decisions.
Return on Equity = Net Profit ÷ Shareholders Equity
Returns are usually compared to costs to measure the efficiency of capital. Simpson Manufacturing’s cost of equity is 8.49%. Some of Simpson Manufacturing’s peers may have a higher ROE but its cost of equity could exceed this return, leading to an unsustainable negative discrepancy i.e. the company spends more than it earns. This is not the case for Simpson Manufacturing which is reassuring. ROE can be split up into three useful ratios: net profit margin, asset turnover, and financial leverage. This is called the Dupont Formula:
Dupont Formula
ROE = profit margin × asset turnover × financial leverage
ROE = (annual net profit ÷ sales) × (sales ÷ assets) × (assets ÷ shareholders’ equity)
ROE = annual net profit ÷ shareholders’ equity

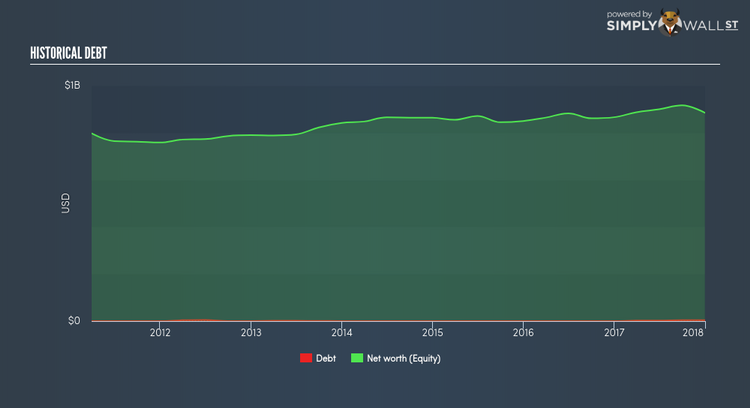
Basically, profit margin measures how much of revenue trickles down into earnings which illustrates how efficient the business is with its cost management. Asset turnover reveals how much revenue can be generated from Simpson Manufacturing’s asset base. Finally, financial leverage will be our main focus today. It shows how much of assets are funded by equity and can show how sustainable the company’s capital structure is. Since ROE can be inflated by excessive debt, we need to examine Simpson Manufacturing’s debt-to-equity level. Currently Simpson Manufacturing has virtually no debt, which means its returns are predominantly driven by equity capital. This could explain why Simpson Manufacturing’s’ ROE is lower than its industry peers, most of which may have some degree of debt in its business.
Next Steps:
While ROE is a relatively simple calculation, it can be broken down into different ratios, each telling a different story about the strengths and weaknesses of a company. While Simpson Manufacturing exhibits a weak ROE against its peers, its returns are sufficient enough to cover its cost of equity. Its appropriate level of leverage means investors can be more confident in the sustainability of Simpson Manufacturing’s return with a possible increase should the company decide to increase its debt levels. ROE is a helpful signal, but it is definitely not sufficient on its own to make an investment decision.
For Simpson Manufacturing, I’ve put together three important aspects you should look at:
Financial Health: Does it have a healthy balance sheet? Take a look at our free balance sheet analysis with six simple checks on key factors like leverage and risk.
Valuation: What is Simpson Manufacturing worth today? Is the stock undervalued, even when its growth outlook is factored into its intrinsic value? The intrinsic value infographic in our free research report helps visualize whether Simpson Manufacturing is currently mispriced by the market.
Other High-Growth Alternatives : Are there other high-growth stocks you could be holding instead of Simpson Manufacturing? Explore our interactive list of stocks with large growth potential to get an idea of what else is out there you may be missing!
To help readers see pass the short term volatility of the financial market, we aim to bring you a long-term focused research analysis purely driven by fundamental data. Note that our analysis does not factor in the latest price sensitive company announcements.
The author is an independent contributor and at the time of publication had no position in the stocks mentioned.
